
Active Traders · NVDA, TSLA, BTC, GLD, CL and more
PLTR, AMD, AMZN, IBIT, ETHA and 19 More Support and Resistance, Pivots and Highest Volume Levels for Day Traders, Oct 30
Published · Lee H.
MyLinedChart works however you get to a trade: AI-Assisted, Discretionary, Quant, or Macro. Export your lines, levels plus the whole chart as XLSX, JSON, or CSV. Or, let AI do all the work for you.
Here’s an overview of how MyLinedChart compares to TradingView and TrendSpider. Available on Windows, Apple and Android.
Looking for a pro to build your trading workflows? Reach out on Upwork.
A recap of how the October 29th trading session and levels played out:
NVDA (NVIDIA)
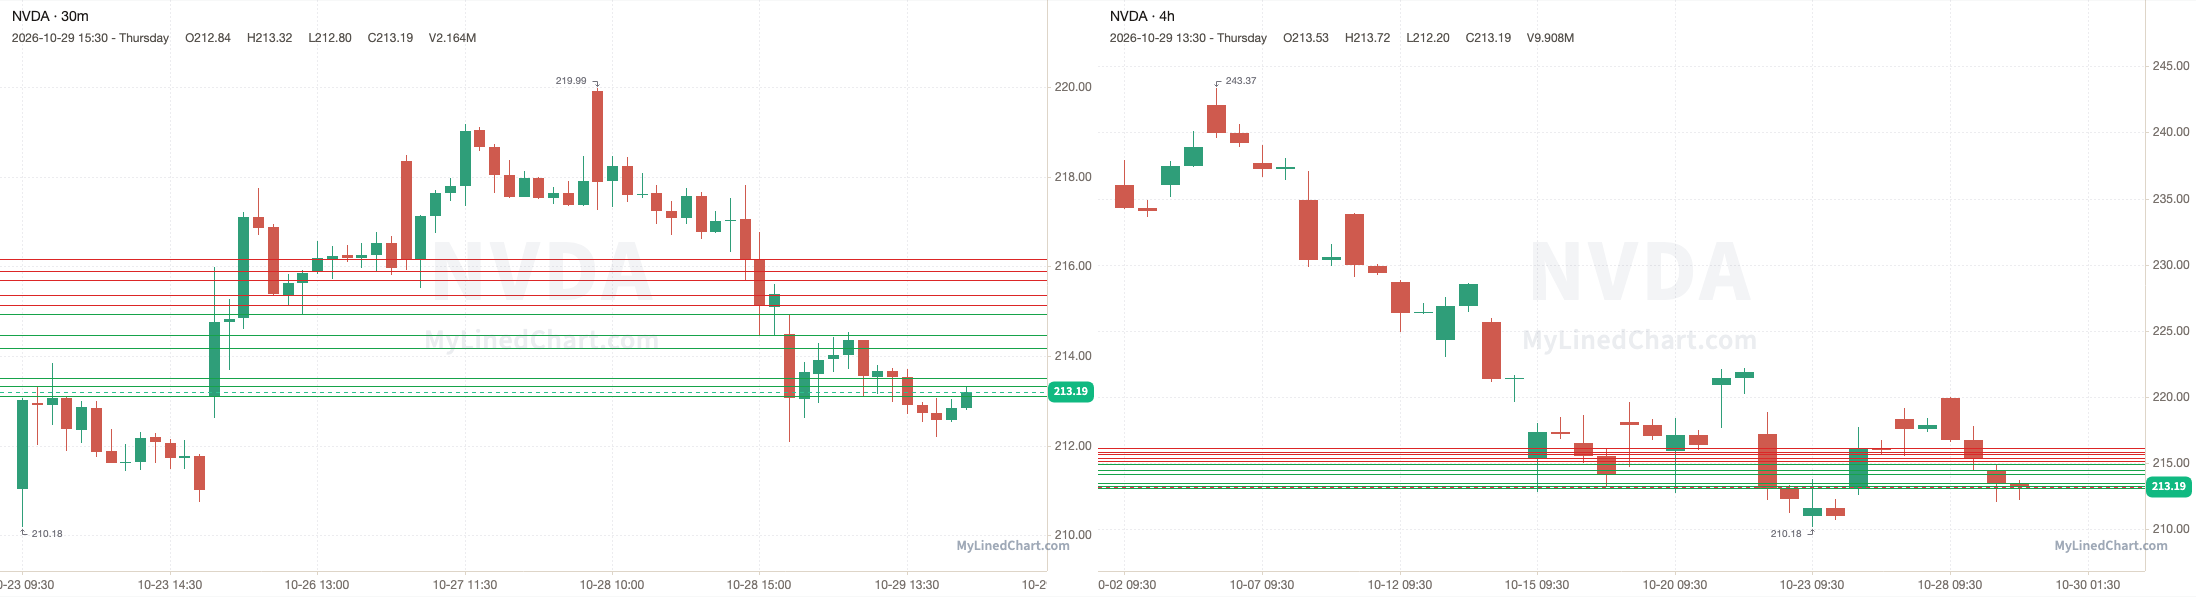
NVDA opened at 214.49, popped above the 214.93 pivot to a high of 214.95, then lost it and ran through every support level down to 213.10, and kept going to a low of 212.08, then ended up closing at 213.19. Finishing the trading session down 0.61% intraday and down 0.93% overall.
October 29th session levels:
All listed levels: 213.10, 213.32, 213.50, 214.18, 214.48, 214.93, 215.14, 215.37, 215.70, 215.89, 216.16
Resistance above: 215.14, 215.37, 215.70, 215.89, 216.16
Support below: 214.93, 214.48, 214.18, 213.50, 213.32, 213.10
Nearest pivot: 214.93
Above 215.14 → 215.37 next
Lose 214.93 → 214.48 next
TSLA (Tesla)
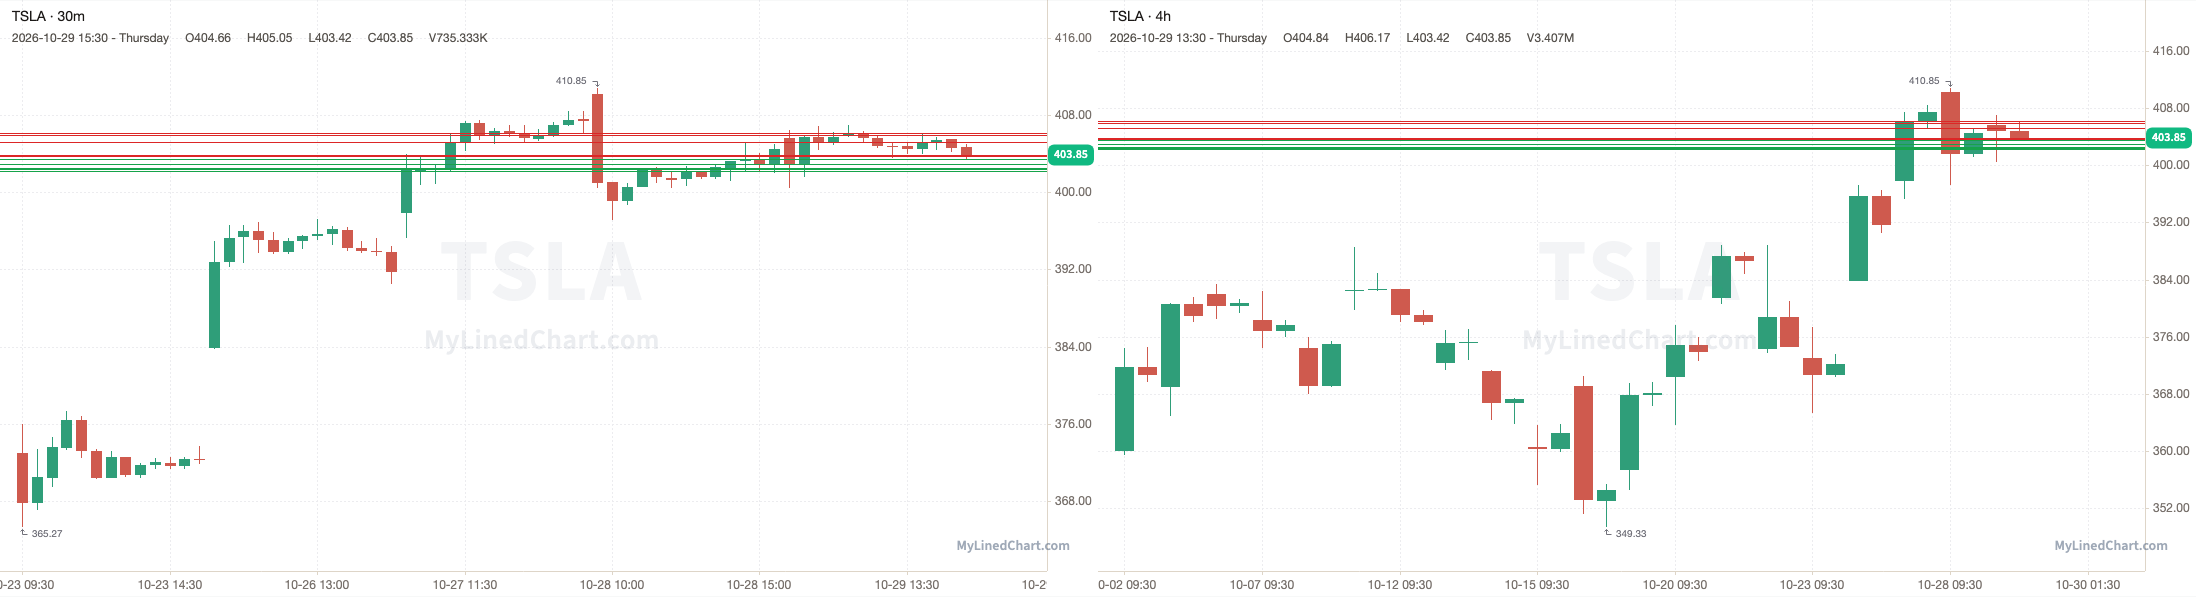
TSLA opened at 405.63, broke below the 403.73 pivot and ran through every support level down to 402.25, and kept going to a low of 400.50, then ended up closing at 403.85. Finishing the trading session down 0.44% intraday and up 0.08% overall.
October 29th session levels:
All listed levels: 402.25, 402.38, 402.51, 402.95, 403.50, 403.73, 403.85, 405.20, 405.94, 406.14
Resistance above: 403.73, 403.85, 405.20, 405.94, 406.14
Support below: 403.50, 402.95, 402.51, 402.38, 402.25
Nearest pivot: 403.73
Above 403.73 → 403.85 next
Lose 403.50 → 402.95 next
BTC (Bitcoin)
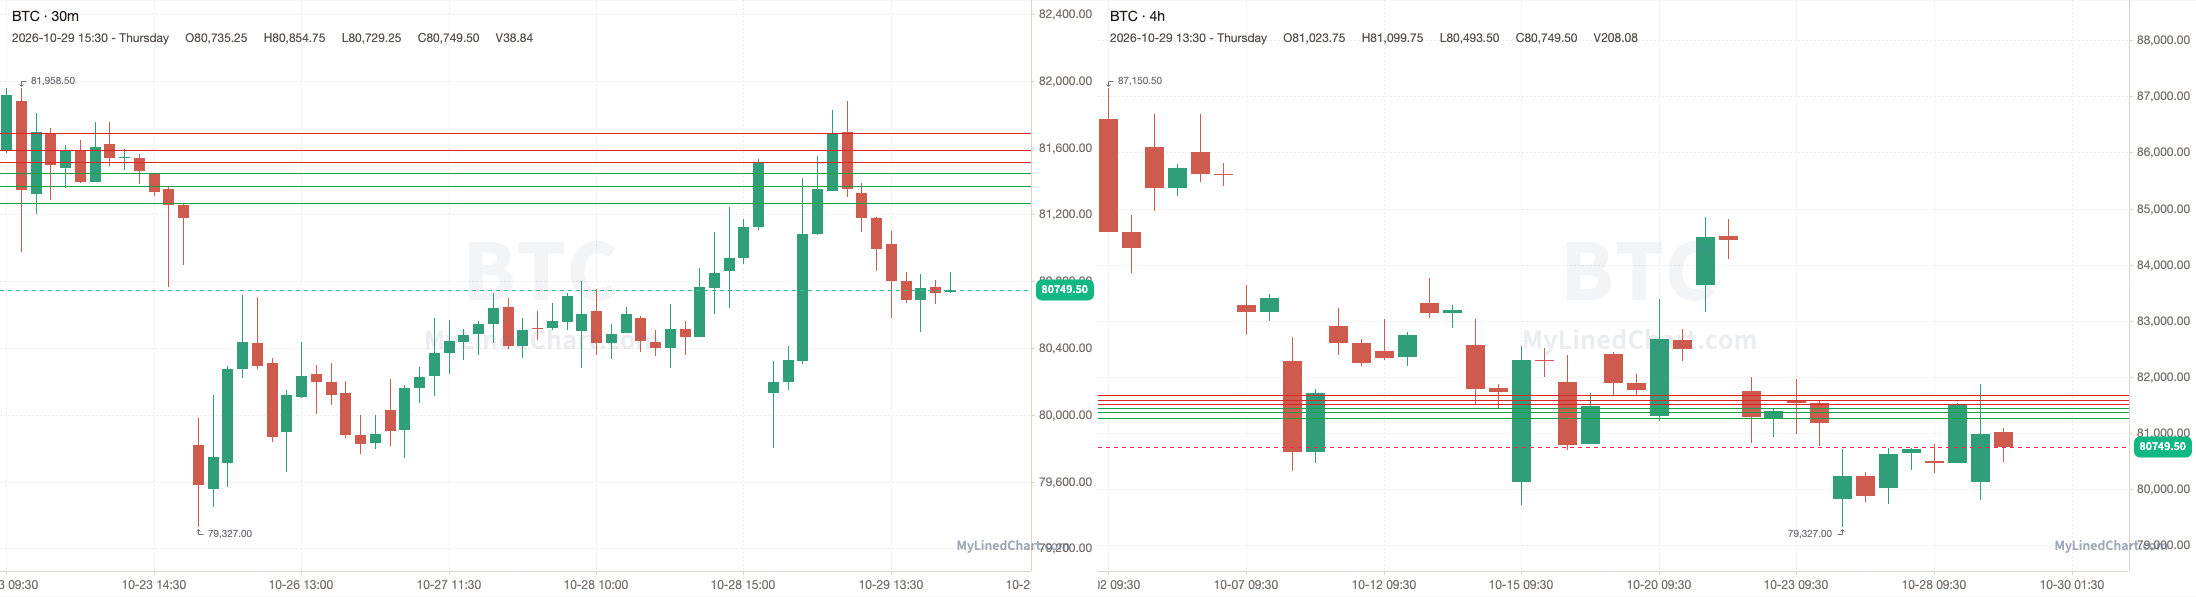
BTC opened at 80133.25, broke above the 81513.50 pivot and ran through every resistance level up to 81686.25, and kept going to a high of 81881.25, then ended up closing at 80749.50. Finishing the trading session up 0.77% intraday and down 0.94% overall.
October 29th session levels:
All listed levels: 81267.75, 81371.50, 81451.25, 81513.50, 81583.50, 81686.25
Resistance above: 81513.50, 81583.50, 81686.25
Support below: 81451.25, 81371.50, 81267.75
Nearest pivot: 81513.50
Above 81513.50 → 81583.50 next
Lose 81451.25 → 81371.50 next
ETH (Ethereum)
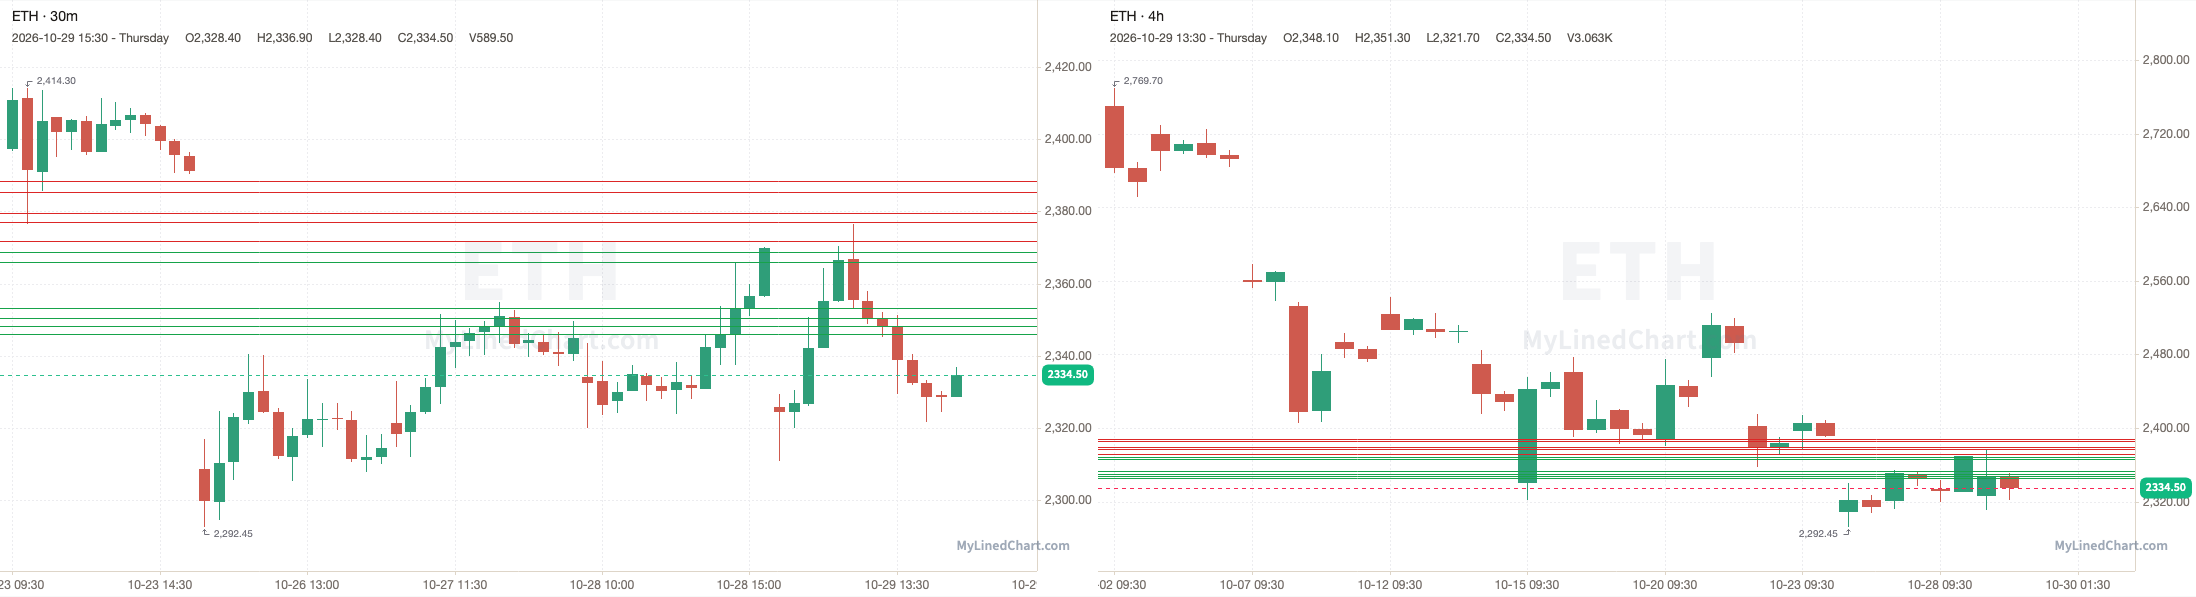
ETH opened at 2325.90, broke above the 2368.80 pivot and ran up to tag 2371.90, with a high of 2376.60, then ended up closing at 2334.50. Finishing the trading session up 0.37% intraday and down 1.49% overall.
October 29th session levels:
All listed levels: 2346.05, 2348.15, 2350.50, 2353.20, 2365.95, 2368.80, 2371.90, 2377.05, 2379.70, 2385.45, 2388.45
Resistance above: 2371.90, 2377.05, 2379.70, 2385.45, 2388.45
Support below: 2368.80, 2365.95, 2353.20, 2350.50, 2348.15, 2346.05
Nearest pivot: 2368.80
Above 2371.90 → 2377.05 next
Lose 2368.80 → 2365.95 next
GLD (SPDR Gold Shares)
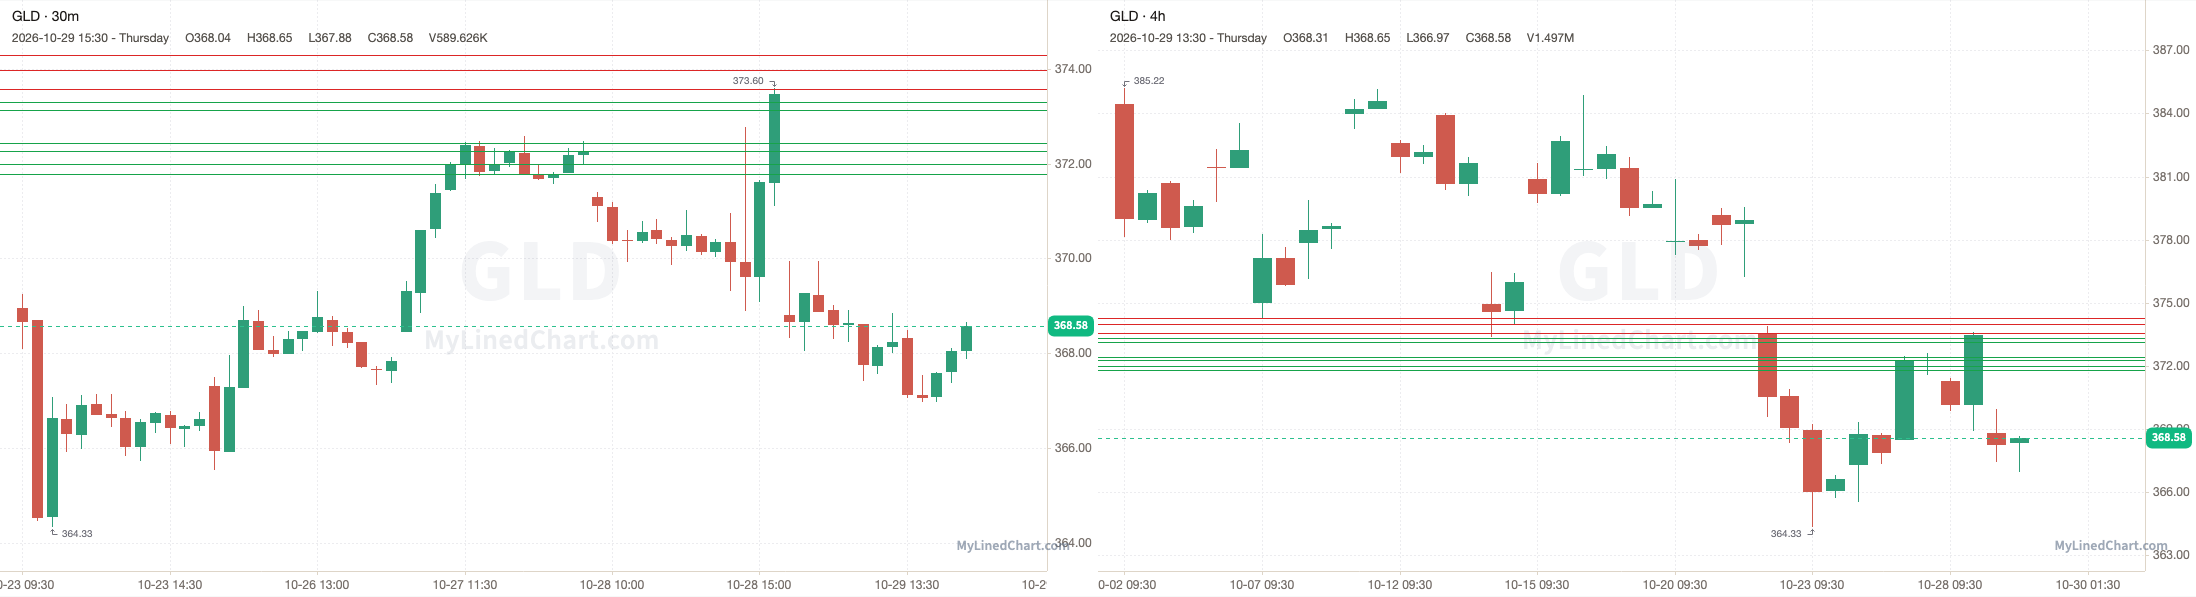
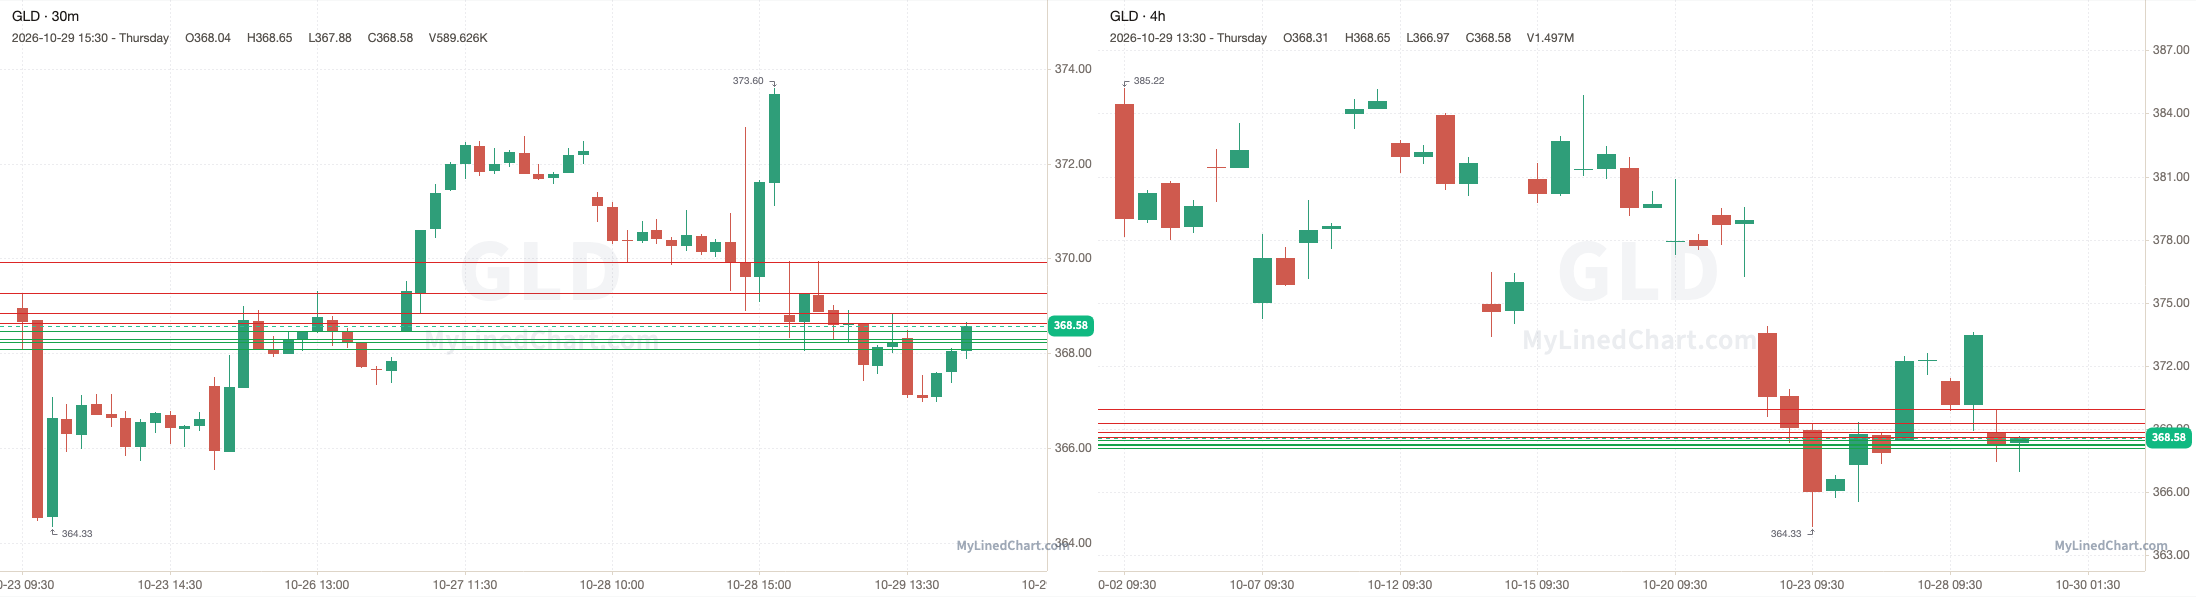
GLD opened at 368.80, under the 373.57 pivot and every level in the plan, and never traded back up to them, with a high of 369.94 and a low of 366.97, then ended up closing at 368.58. Finishing the trading session down 0.06% intraday and down 1.31% overall.
October 29th session levels:
All listed levels: 371.79, 371.99, 372.27, 372.43, 373.14, 373.30, 373.57, 373.98, 374.29
Resistance above: 373.57, 373.98, 374.29
Support below: 373.30, 373.14, 372.43, 372.27, 371.99, 371.79
Nearest pivot: 373.57
Above 373.57 → 373.98 next
Lose 373.30 → 373.14 next
SLV (iShares Silver Trust)
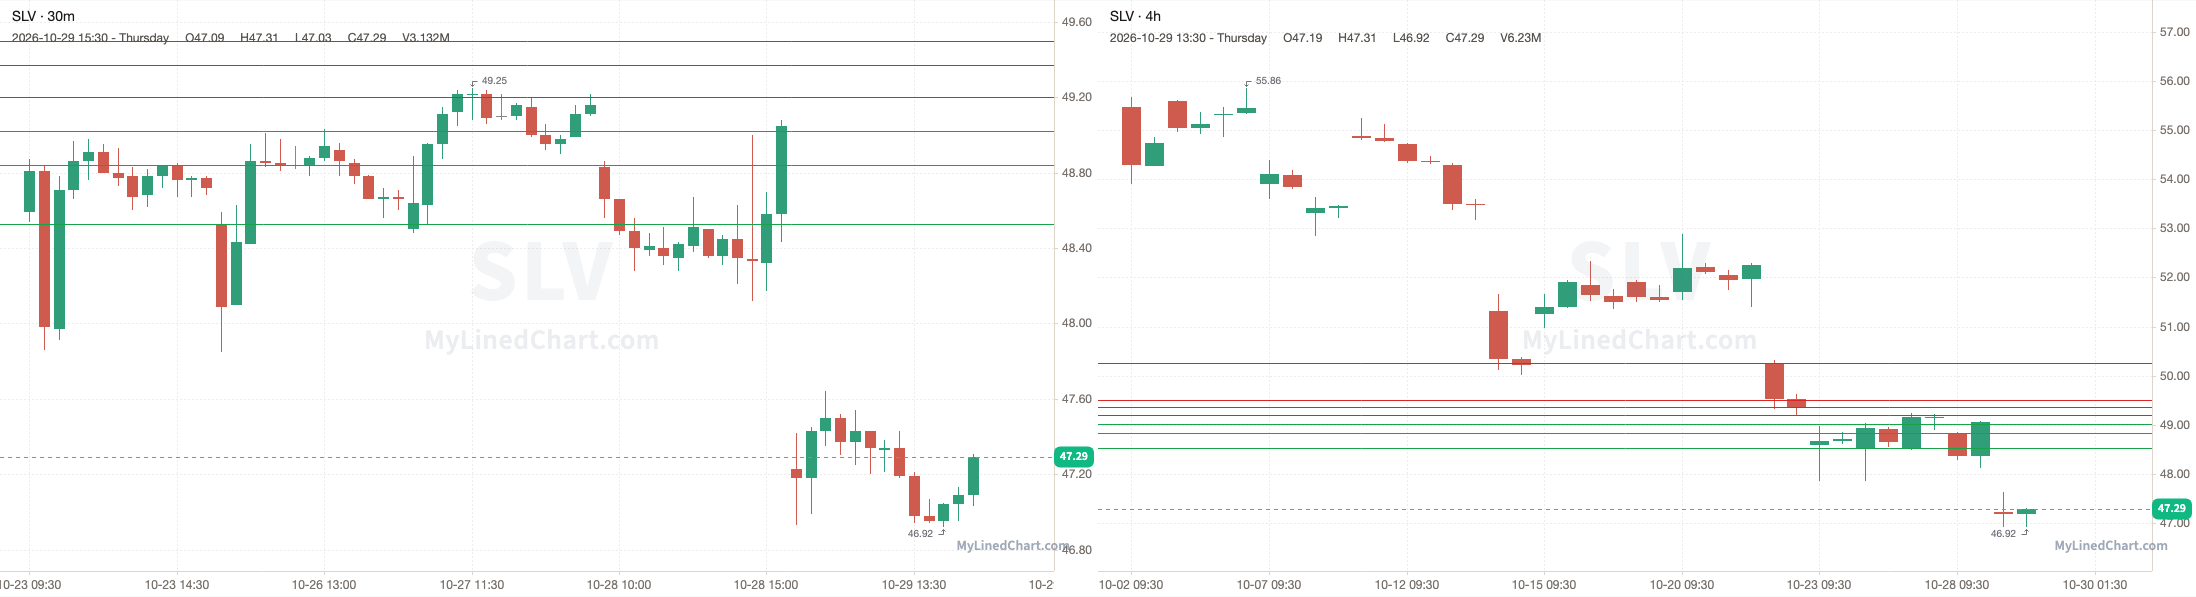
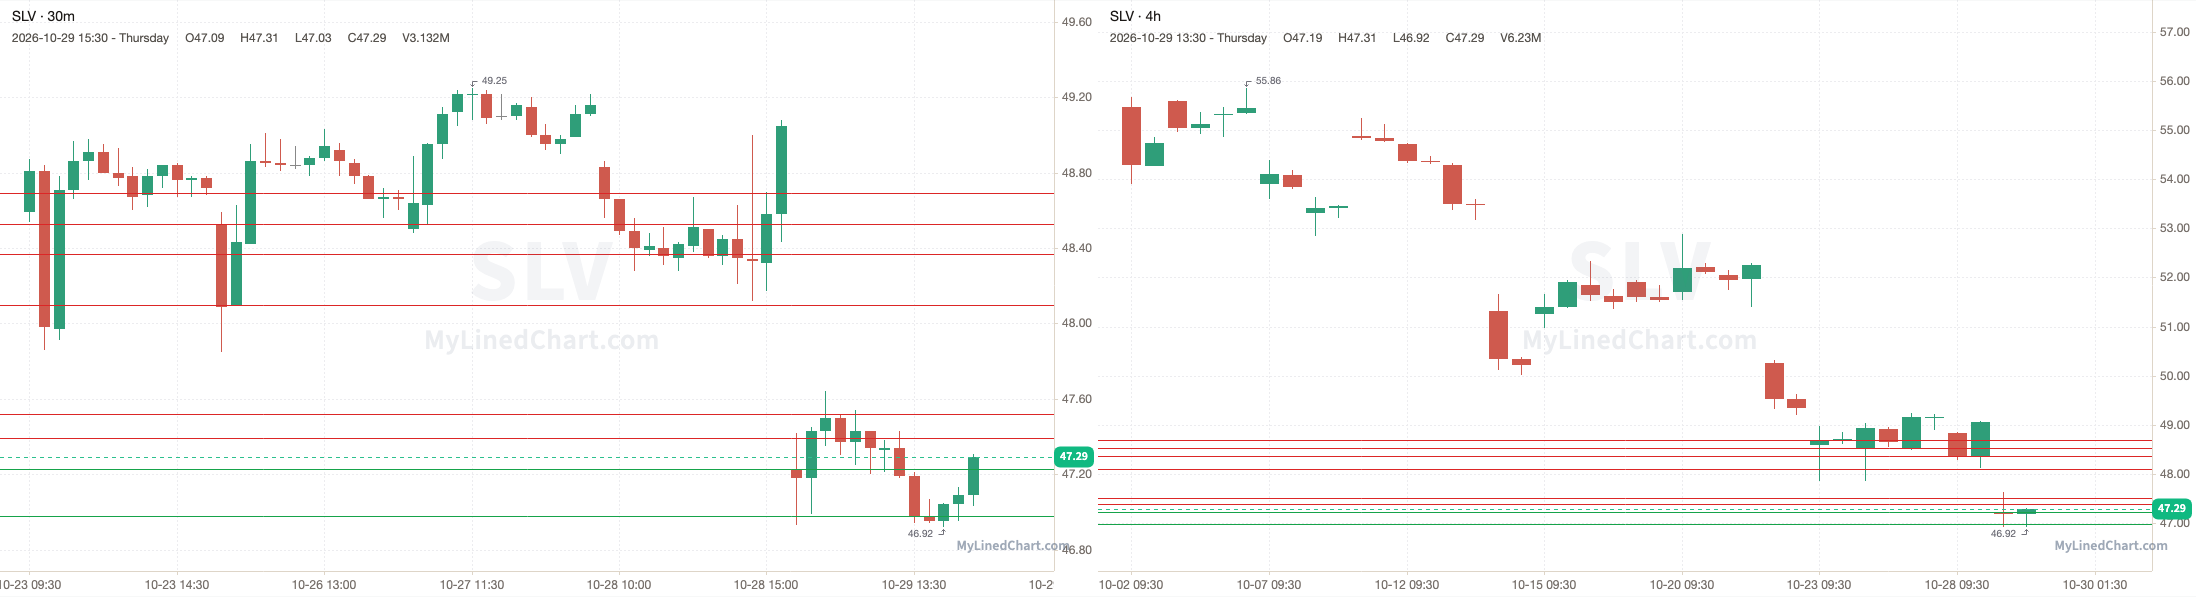
SLV opened at 47.23, under the 49.02 pivot and every level in the plan, and never traded back up to them, with a high of 47.64 and a low of 46.92, then ended up closing at 47.29. Finishing the trading session up 0.13% intraday and down 3.59% overall.
October 29th session levels:
All listed levels: 48.53, 48.84, 49.02, 49.20, 49.37, 49.50, 50.25
Resistance above: 49.20, 49.37, 49.50, 50.25
Support below: 49.02, 48.84, 48.53
Nearest pivot: 49.02
Above 49.20 → 49.37 next
Lose 49.02 → 48.84 next
CL (Crude Oil futures)
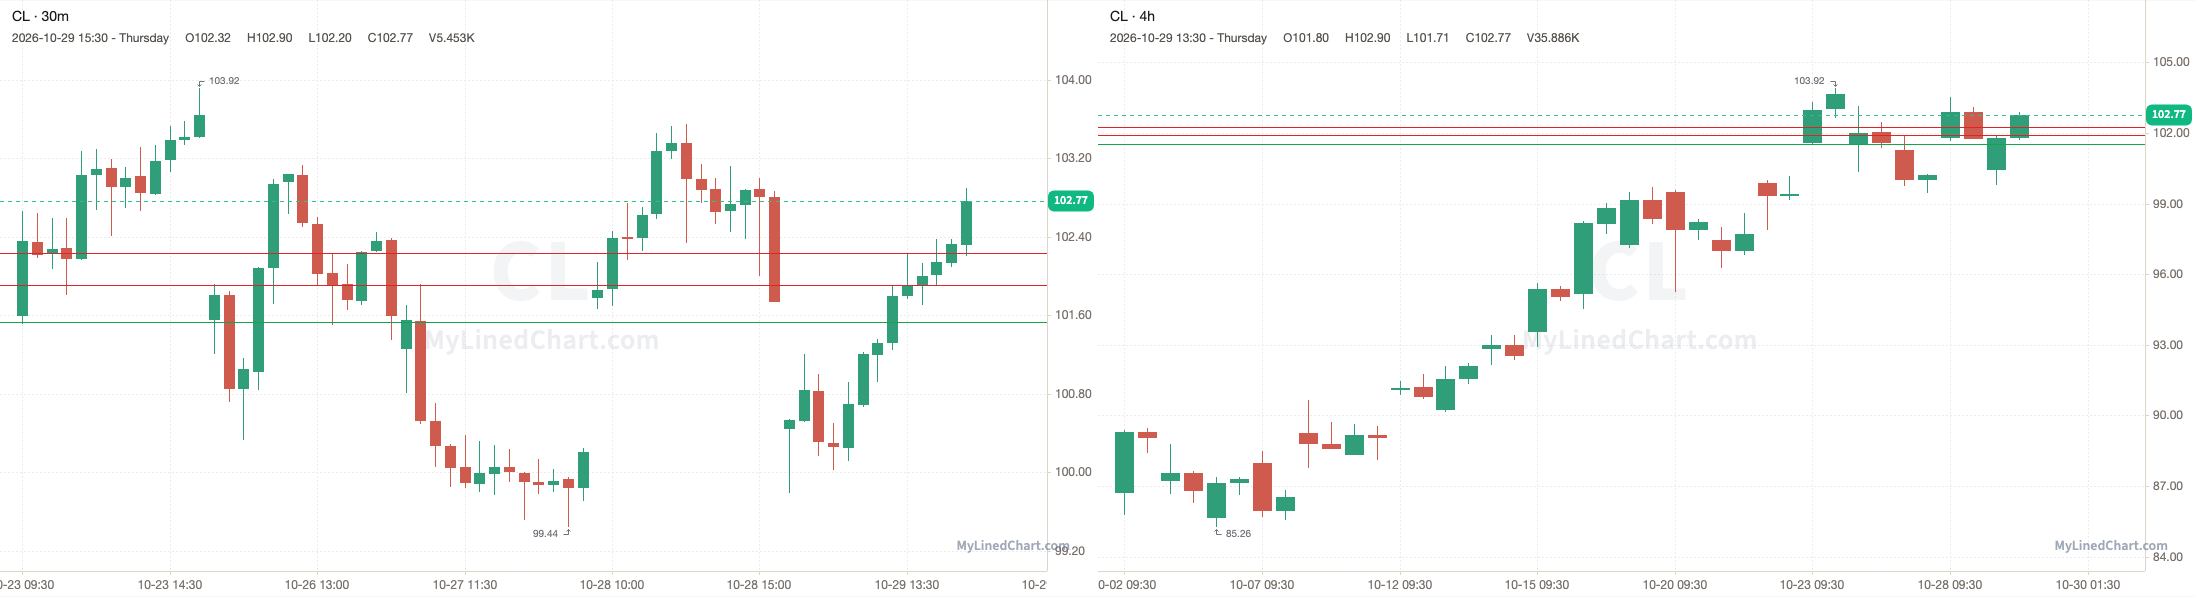
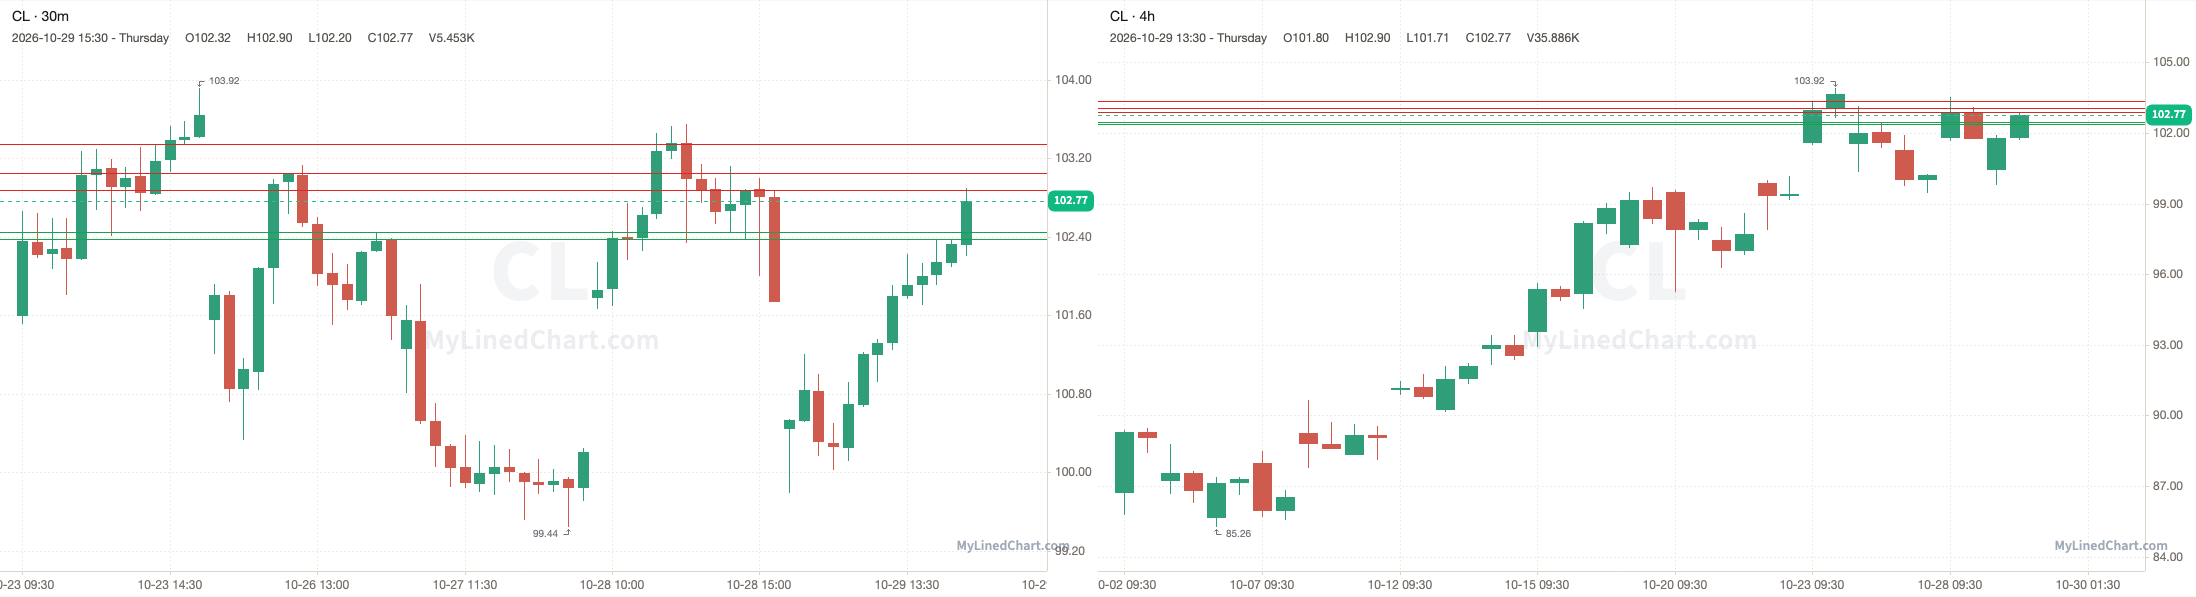
CL opened at 100.44, broke above the 101.91 pivot and ran through every resistance level up to 102.24, and kept going to a high of 102.90, then ended up closing at 102.77. Finishing the trading session up 2.32% intraday.
October 29th session levels:
All listed levels: 101.53, 101.91, 102.24
Resistance above: 101.91, 102.24
Support below: 101.53
Nearest pivot: 101.91
Above 101.91 → 102.24 next
Lose 101.53 → open air
GC (Gold futures)
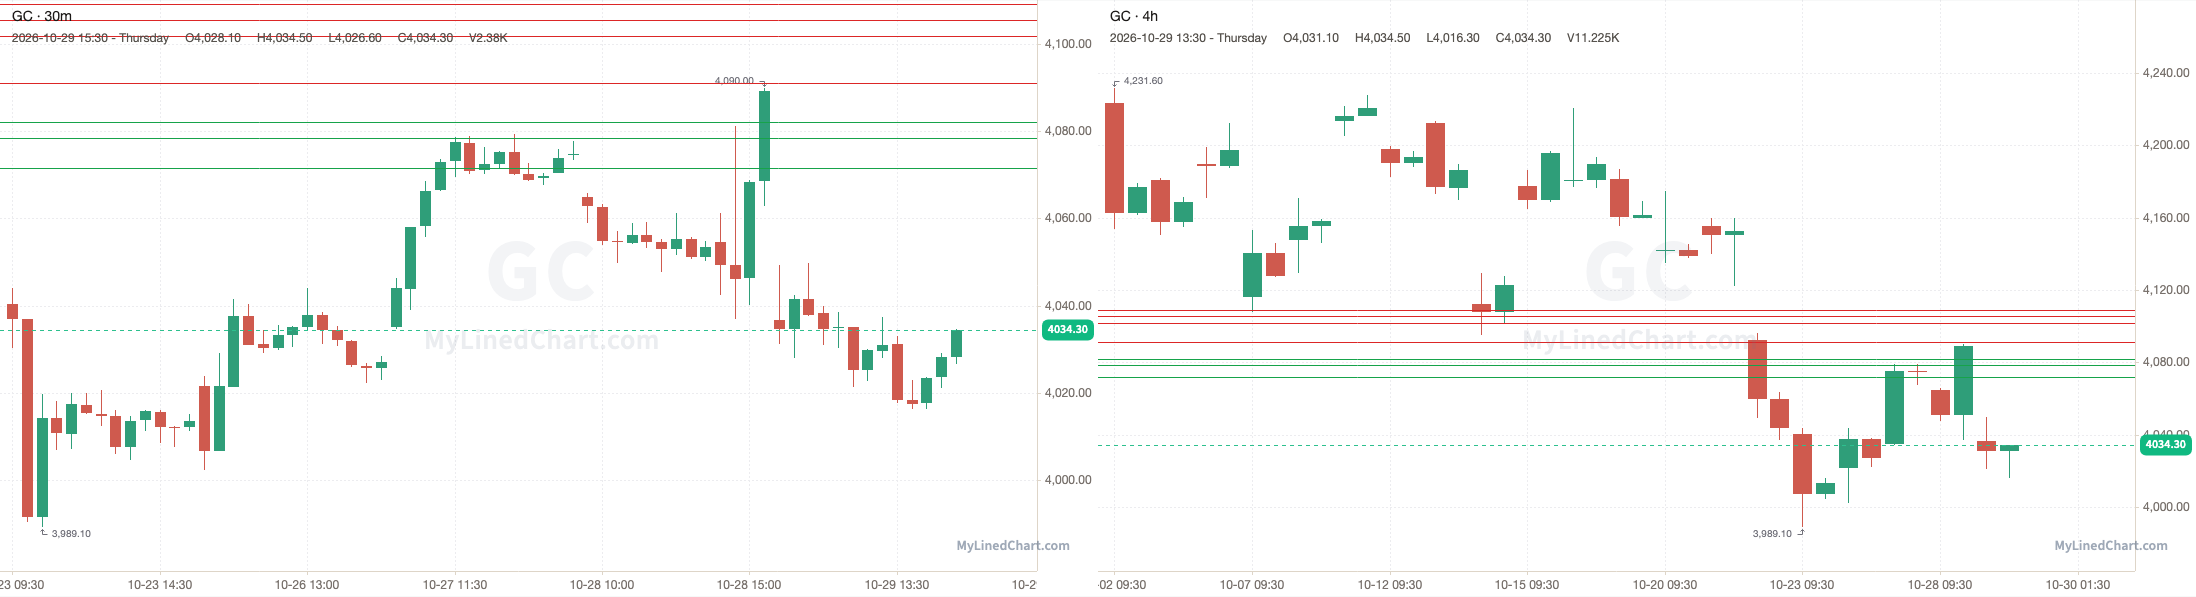
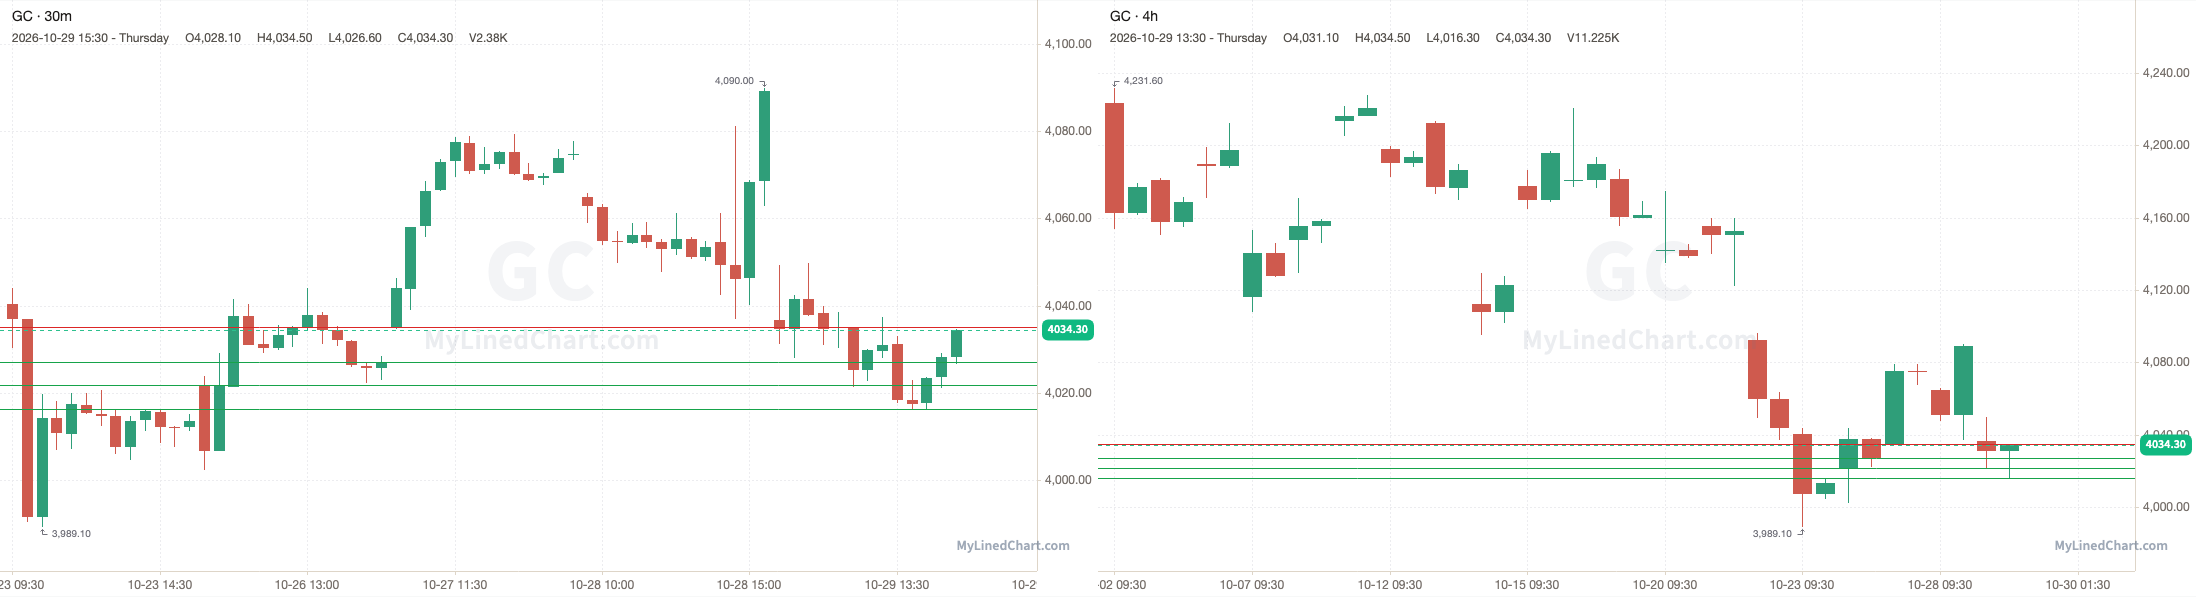
GC opened at 4036.60, under the 4091.20 pivot and every level in the plan, and never traded back up to them, with a high of 4049.80 and a low of 4016.30, then ended up closing at 4034.30. Finishing the trading session down 0.06% intraday.
October 29th session levels:
All listed levels: 4071.70, 4078.50, 4082.10, 4091.20, 4102, 4105.50, 4109.20
Resistance above: 4091.20, 4102, 4105.50, 4109.20
Support below: 4082.10, 4078.50, 4071.70
Nearest pivot: 4091.20
Above 4091.20 → 4102 next
Lose 4082.10 → 4078.50 next
AMD (Advanced Micro Devices)
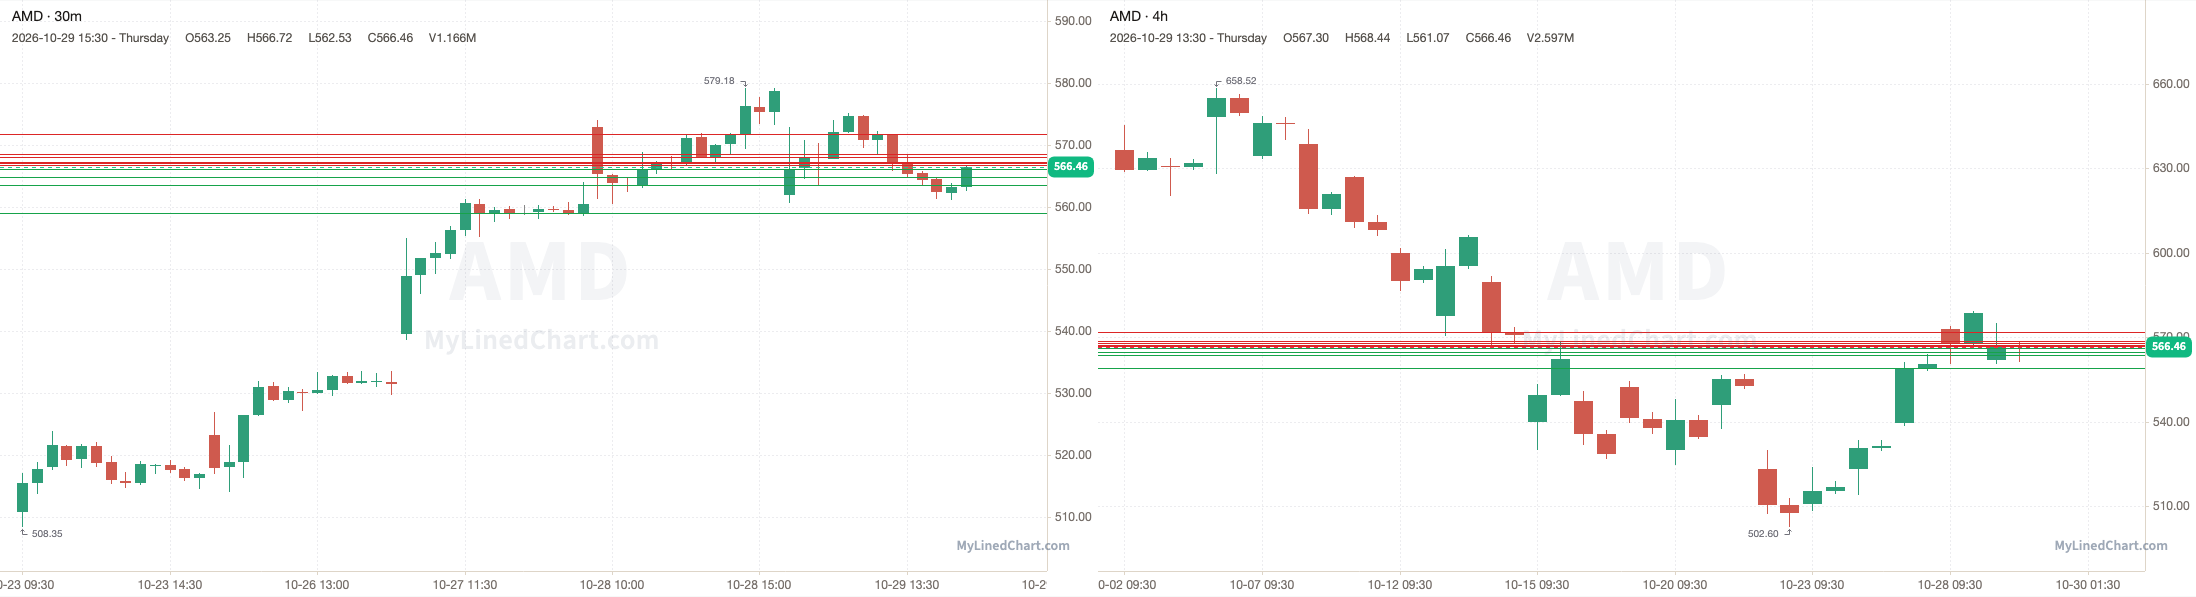
AMD opened at 561.82, broke above the 571.79 pivot and pushed to a high of 575.10, then ended up closing at 566.46. Finishing the trading session up 0.83% intraday and down 2.09% overall.
October 29th session levels:
All listed levels: 521.59, 559.02, 564.76, 566.11, 566.72, 567.10, 571.79, 588.49, 589.65, 590.83, 606.05, 606.20
Resistance above: 588.49, 589.65, 590.83, 606.05, 606.20
Support below: 571.79, 567.10, 566.72, 566.11, 564.76, 559.02, 521.59
Nearest pivot: 571.79
Above 588.49 → 589.65 next
Lose 571.79 → 567.10 next
MSTR (Strategy)
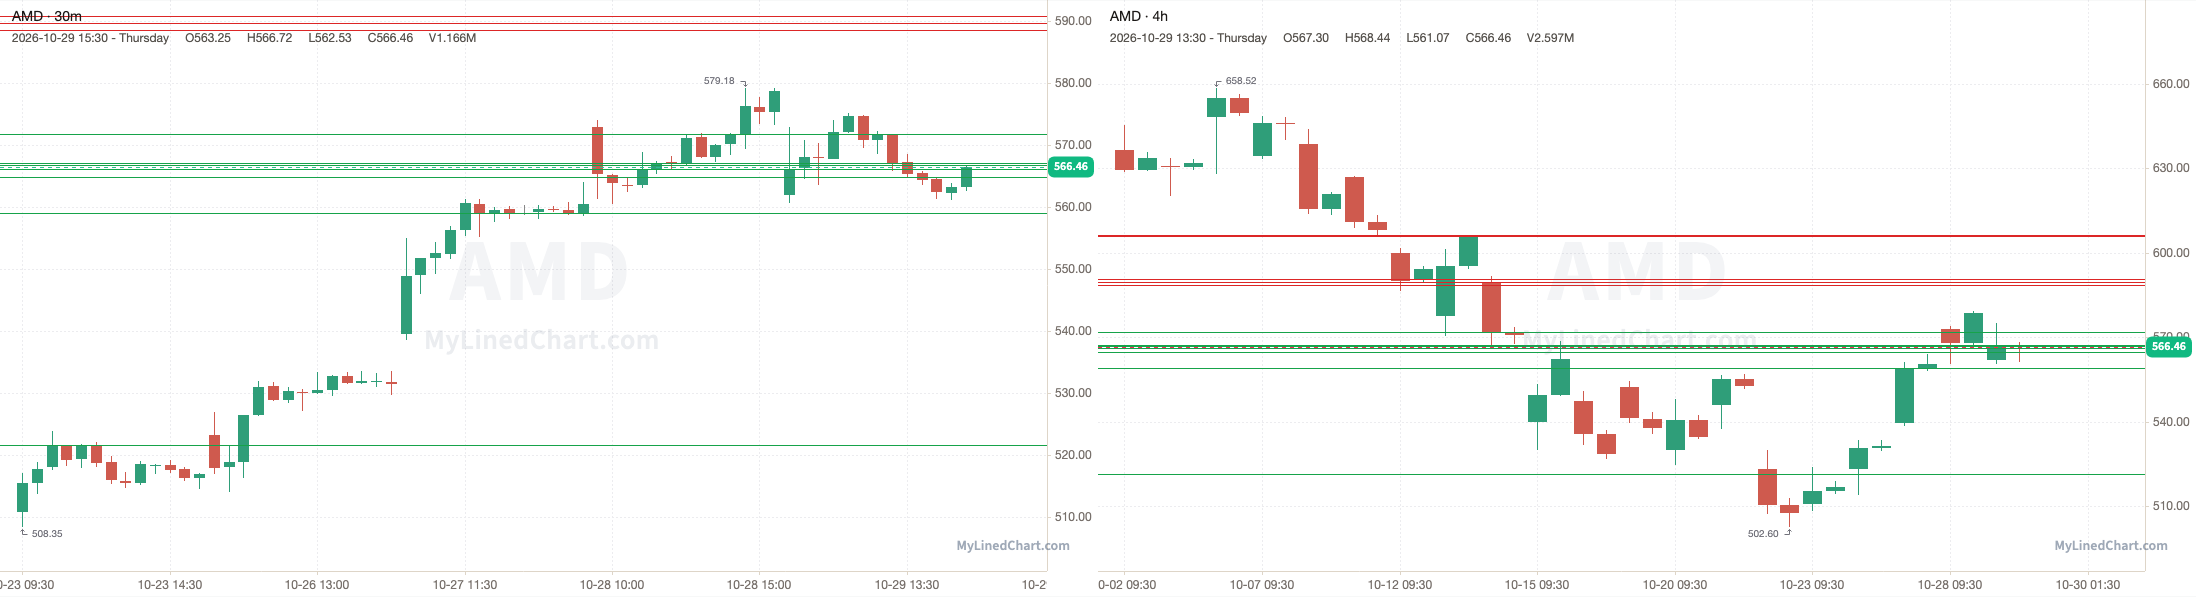
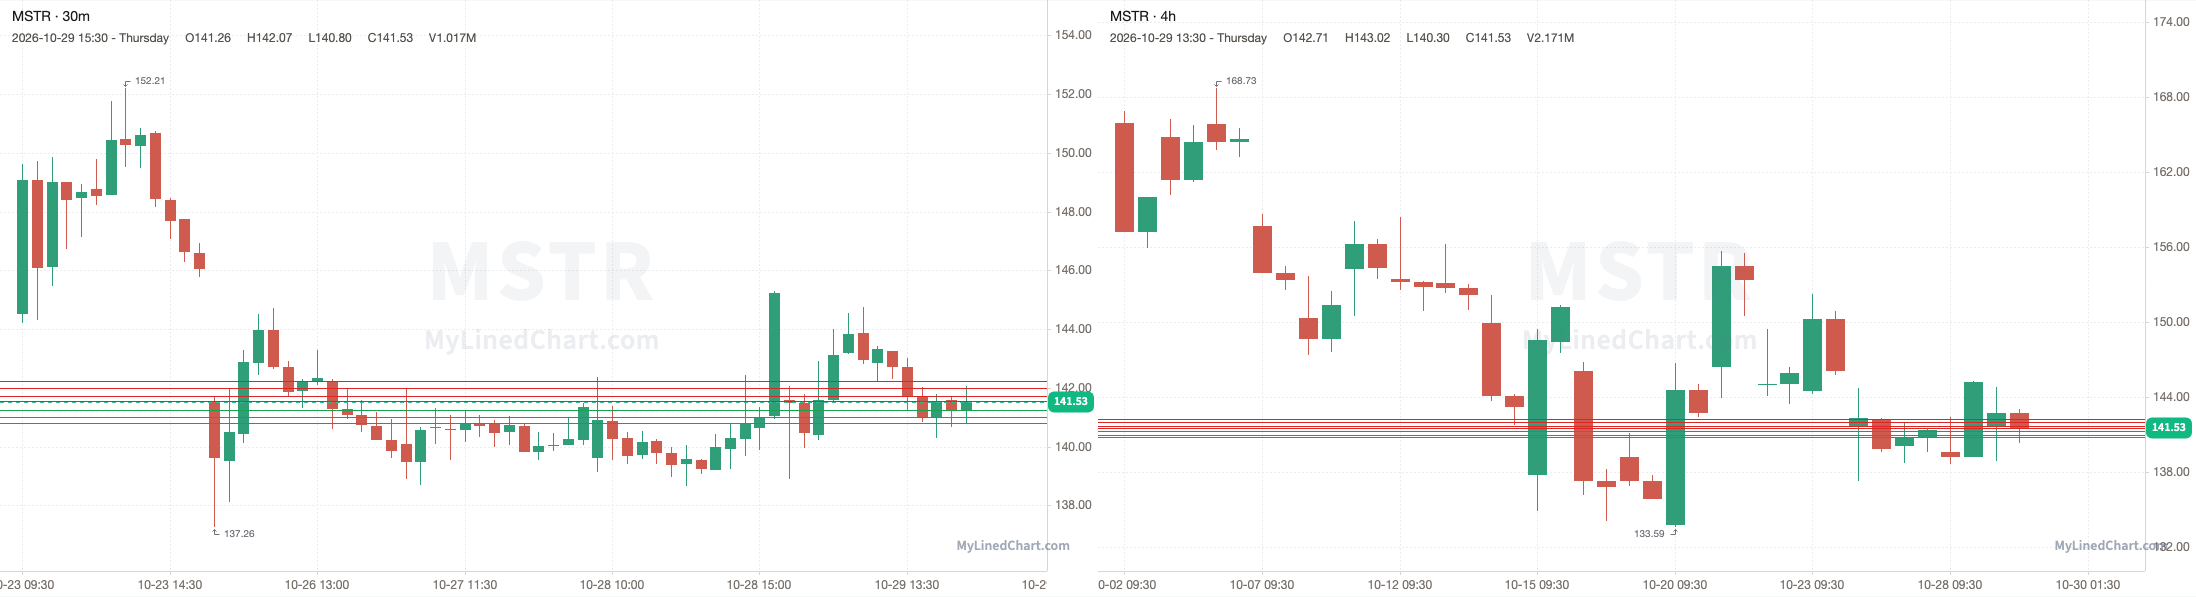
MSTR opened at 141.59, stayed under the 145.04 pivot and dropped to a low of 138.88, then ended up closing at 141.53. Finishing the trading session down 0.04% intraday and down 2.55% overall.
October 29th session levels:
All listed levels: 143.89, 144.34, 144.51, 144.67, 145.04, 145.43, 145.72, 145.90, 146.10, 146.60, 146.77, 146.92
Resistance above: 145.43, 145.72, 145.90, 146.10, 146.60, 146.77, 146.92
Support below: 145.04, 144.67, 144.51, 144.34, 143.89
Nearest pivot: 145.04
Above 145.43 → 145.72 next
Lose 145.04 → 144.67 next
AAPL (Apple)
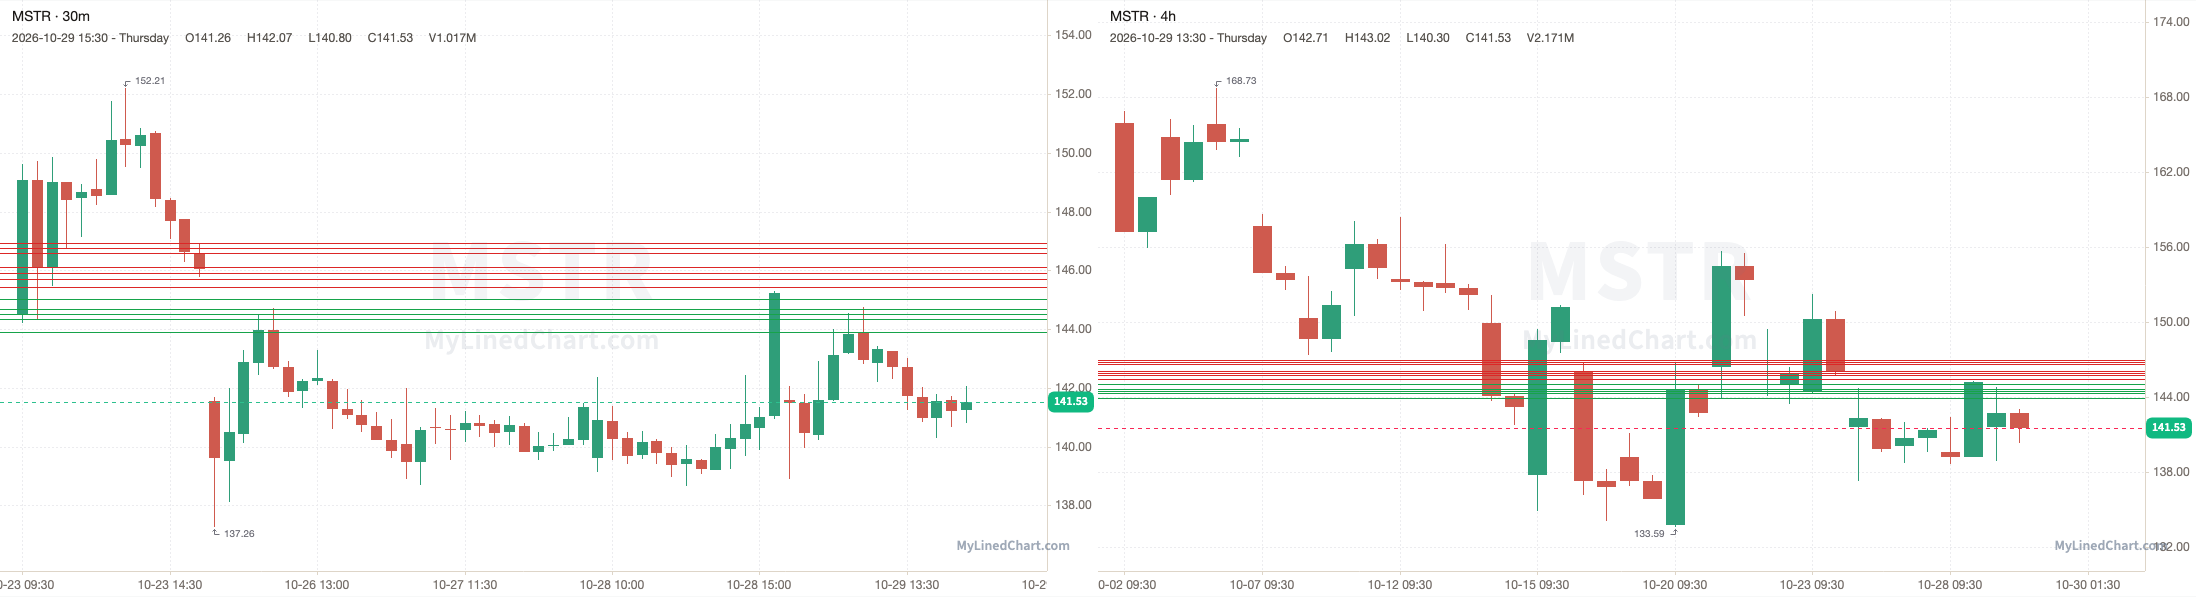
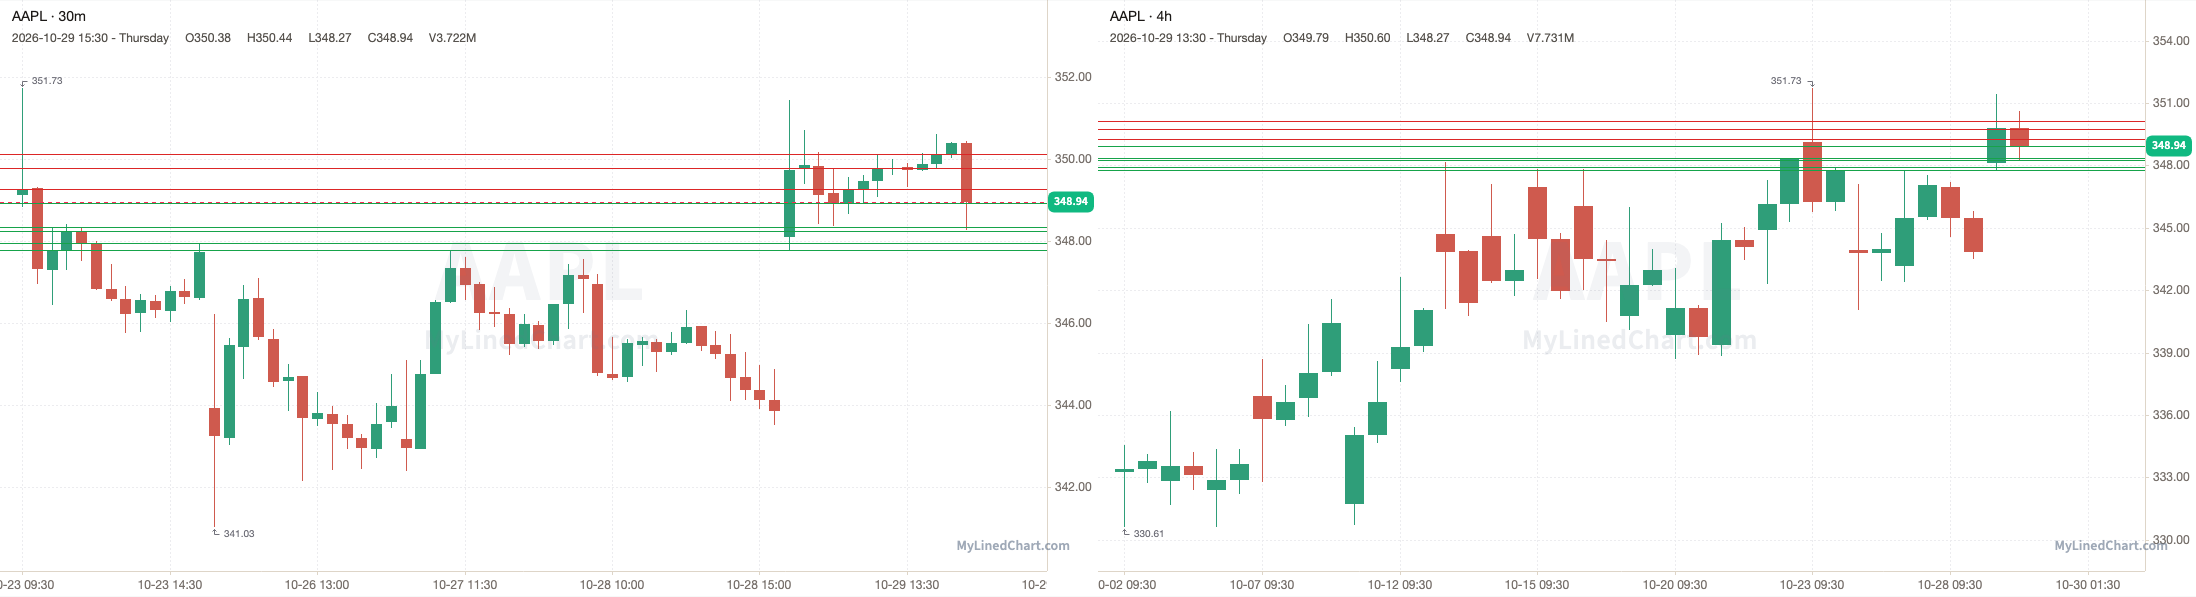
AAPL opened at 348.10, over the 344.12 pivot and every level in the plan, and never traded back down to them, with a high of 351.43 and a low of 347.79, then ended up closing at 348.94. Finishing the trading session up 0.24% intraday and up 1.42% overall.
October 29th session levels:
All listed levels: 342.94, 343.23, 343.54, 343.65, 343.79, 344.12, 344.31, 344.46, 344.65
Resistance above: 344.12, 344.31, 344.46, 344.65
Support below: 343.79, 343.65, 343.54, 343.23, 342.94
Nearest pivot: 344.12
Above 344.12 → 344.31 next
Lose 343.79 → 343.65 next
PLTR (Palantir)
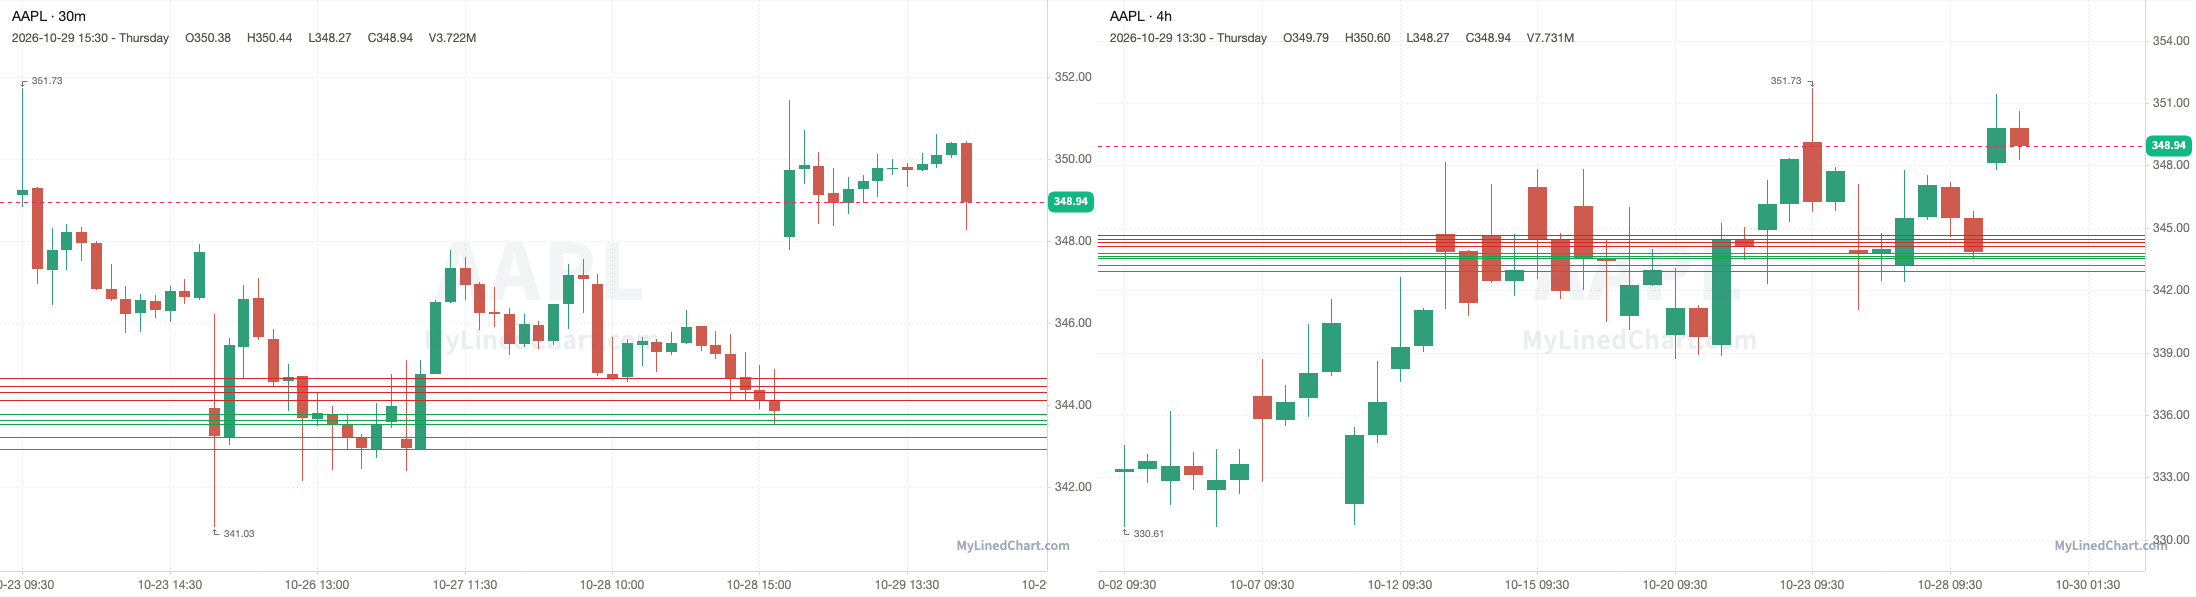
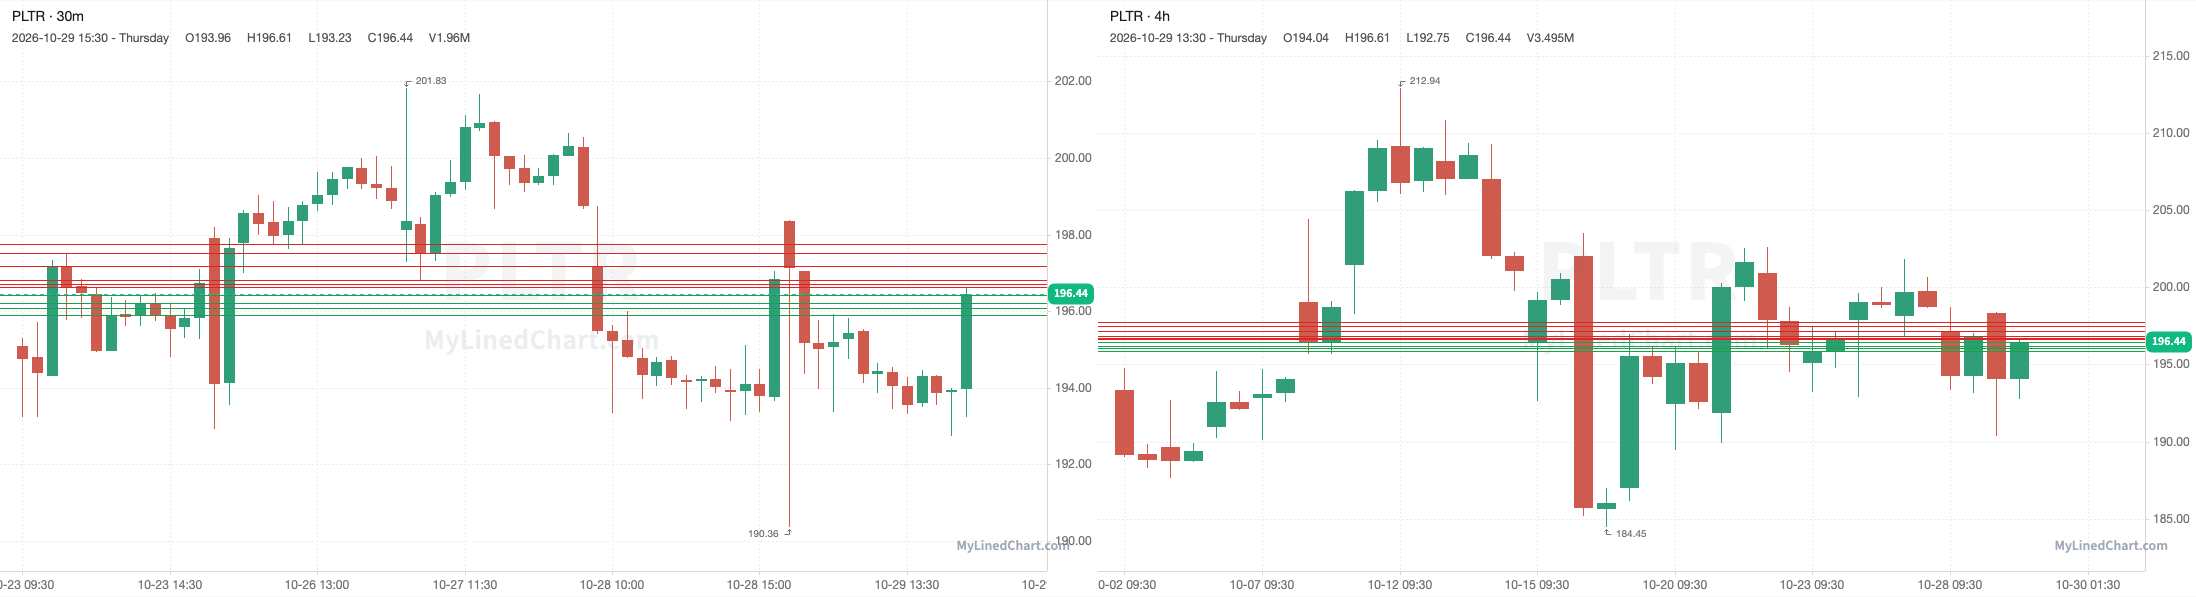
PLTR opened at 198.36, broke below the 196.83 pivot and ran through every support level down to 196.22, and kept going to a low of 190.36, then ended up closing at 196.44. Finishing the trading session down 0.97% intraday and down 0.21% overall.
October 29th session levels:
All listed levels: 196.22, 196.64, 196.72, 196.83, 197.19, 197.33, 197.51, 197.64
Resistance above: 197.19, 197.33, 197.51, 197.64
Support below: 196.83, 196.72, 196.64, 196.22
Nearest pivot: 196.83
Above 197.19 → 197.33 next
Lose 196.83 → 196.72 next
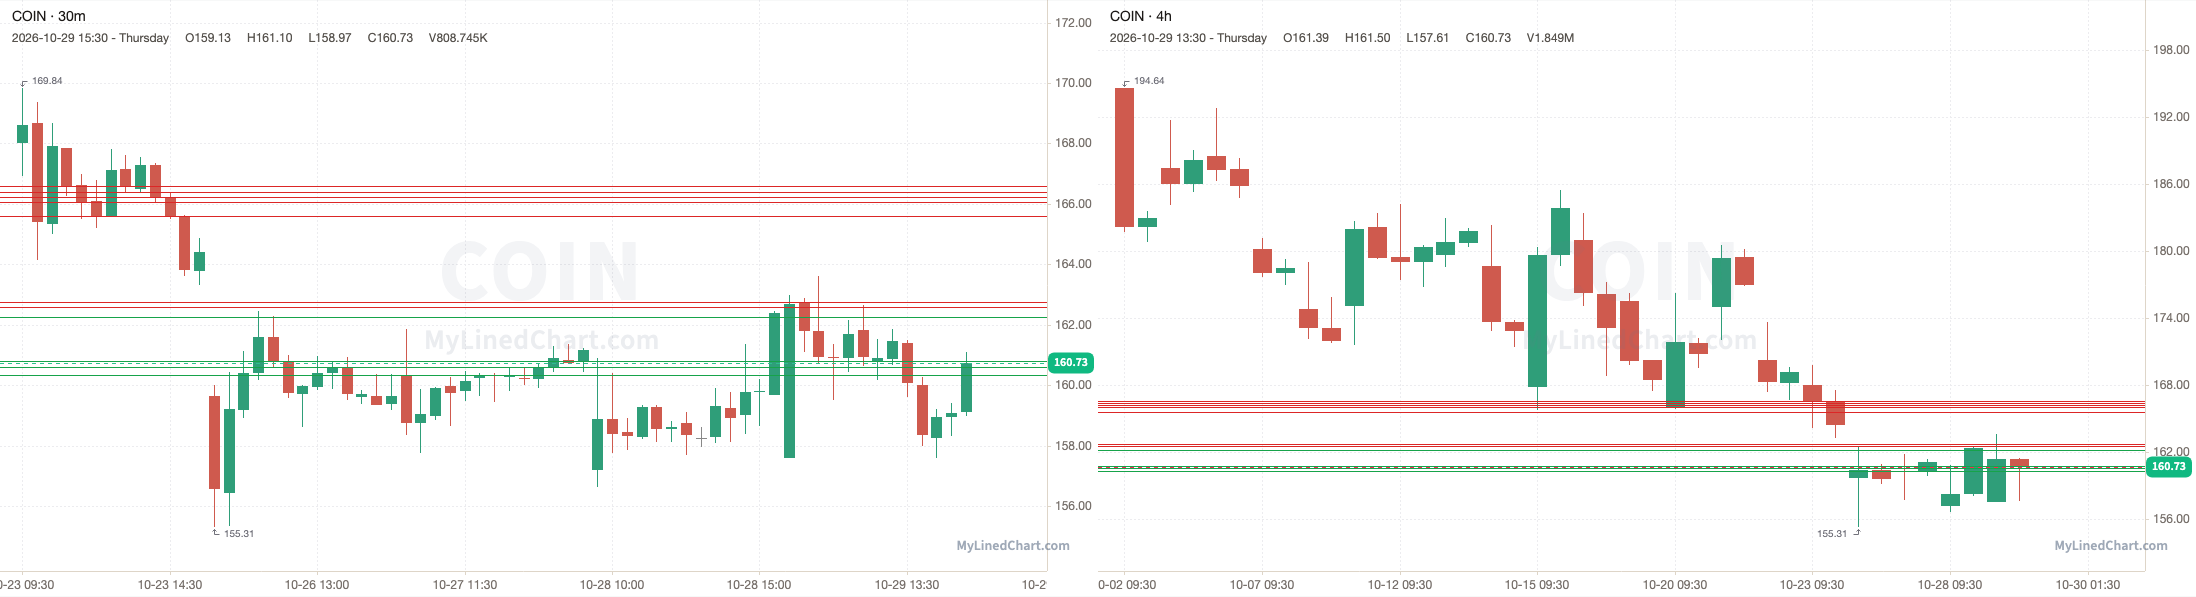
COIN (Coinbase)
COIN opened at 157.59, broke above the 162.58 pivot and ran up to tag 162.76, with a high of 163.60, then ended up closing at 160.73. Finishing the trading session up 1.99% intraday and down 1.05% overall.
October 29th session levels:
All listed levels: 160.34, 160.59, 160.81, 162.25, 162.58, 162.76, 165.60, 166.06, 166.23, 166.39, 166.59
Resistance above: 162.58, 162.76, 165.60, 166.06, 166.23, 166.39, 166.59
Support below: 162.25, 160.81, 160.59, 160.34
Nearest pivot: 162.58
Above 162.58 → 162.76 next
Lose 162.25 → 160.81 next
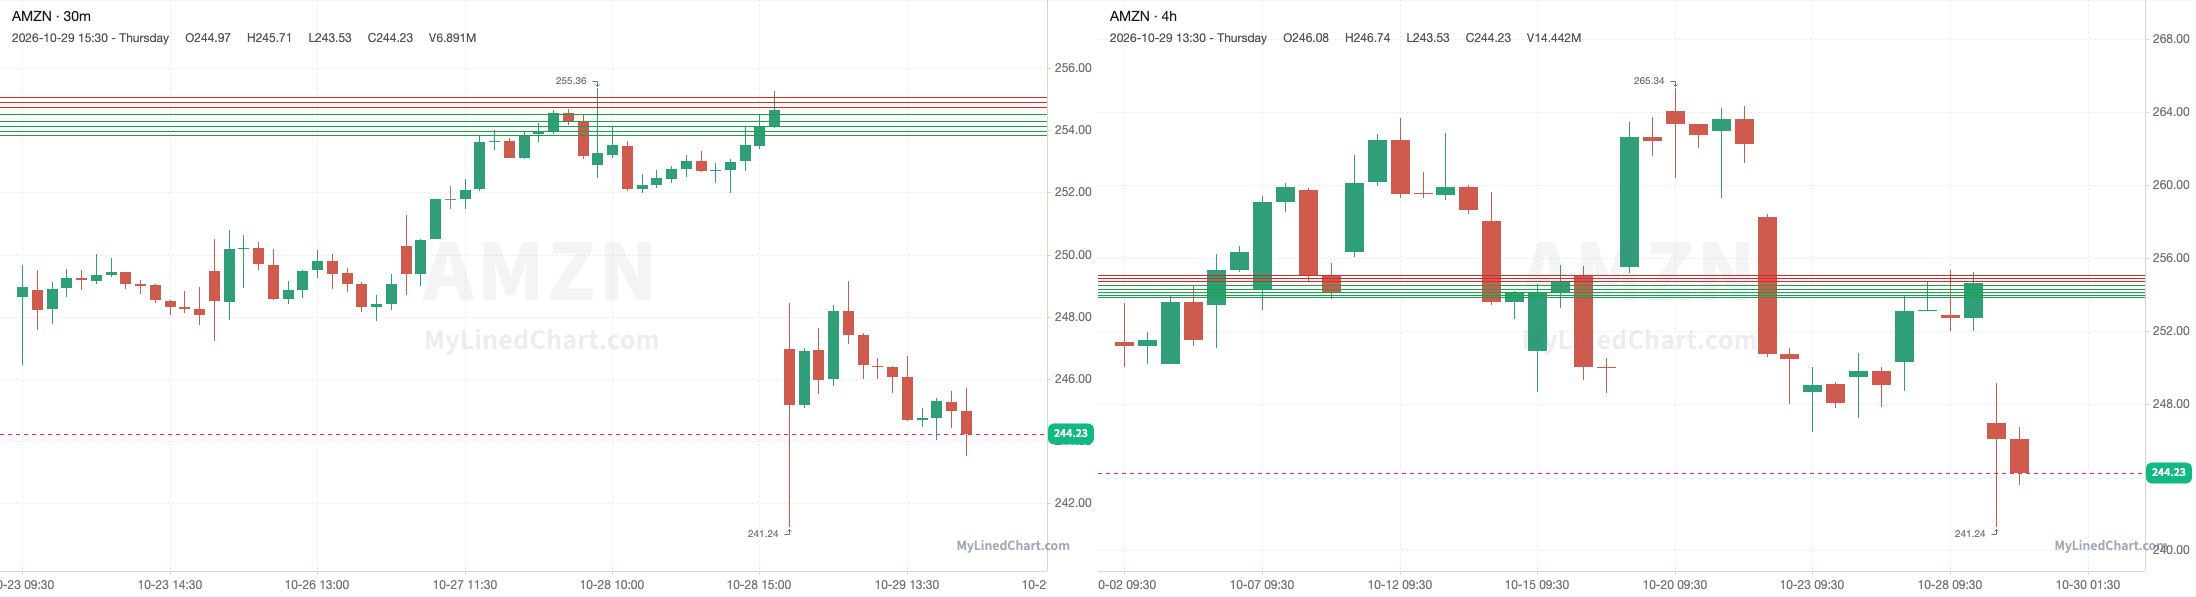
AMZN (Amazon)
AMZN opened at 246.95, under the 254.74 pivot and every level in the plan, and never traded back up to them, with a high of 249.14 and a low of 241.24, then ended up closing at 244.23. Finishing the trading session down 1.10% intraday and down 4.11% overall.
October 29th session levels:
All listed levels: 253.85, 253.96, 254.13, 254.28, 254.52, 254.74, 254.89, 255.08
Resistance above: 254.74, 254.89, 255.08
Support below: 254.52, 254.28, 254.13, 253.96, 253.85
Nearest pivot: 254.74
Above 254.74 → 254.89 next
Lose 254.52 → 254.28 next
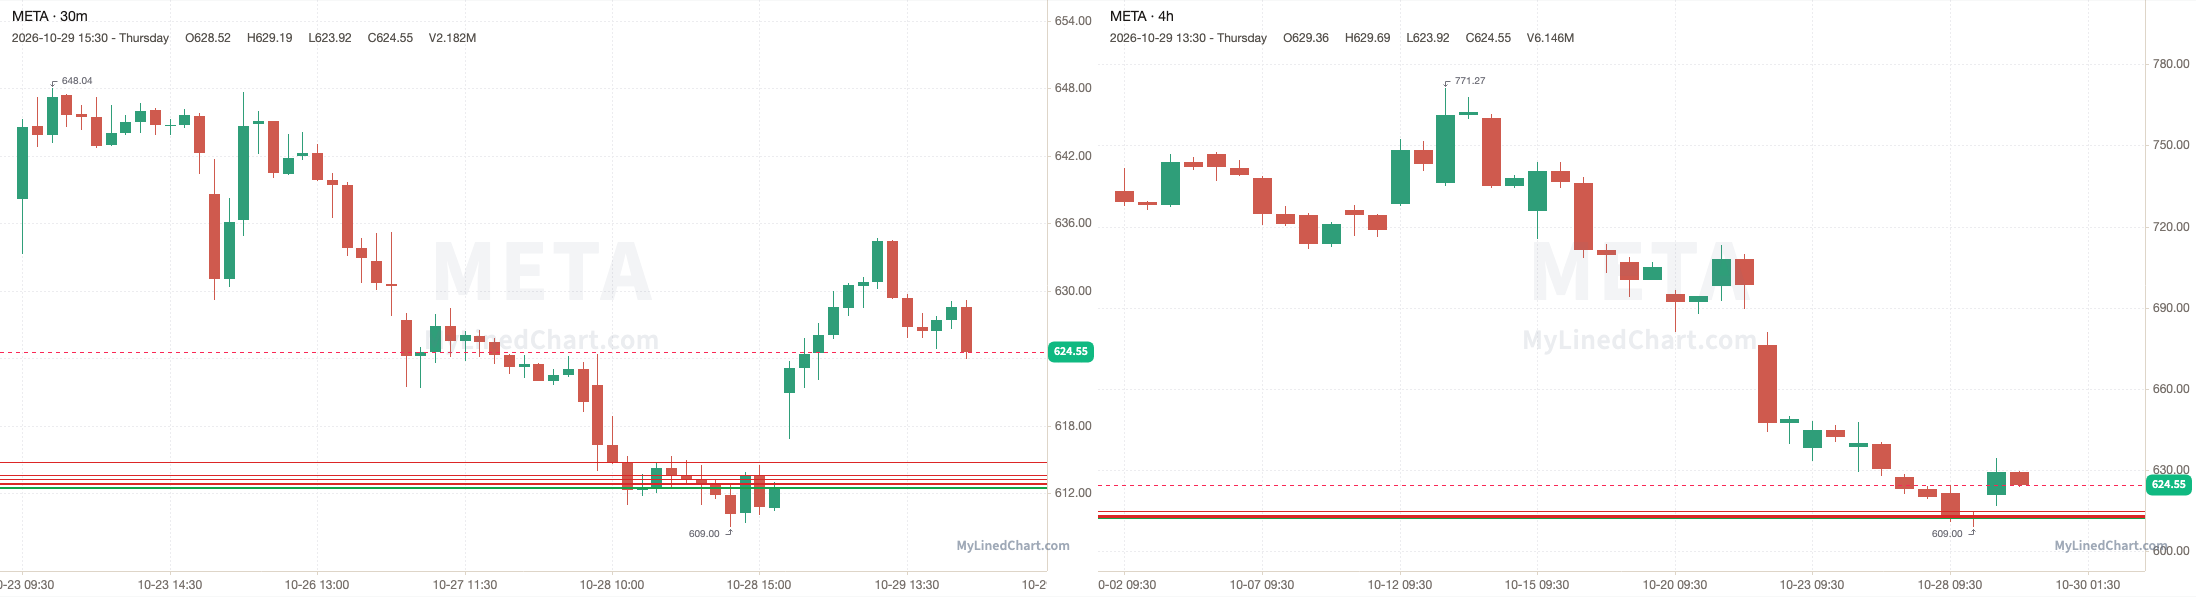
META (Meta Platforms)
META opened at 620.92, over the 612.79 pivot and every level in the plan, and never traded back down to them, with a high of 634.68 and a low of 616.80, then ended up closing at 624.55. Finishing the trading session up 0.58% intraday and up 1.92% overall.
October 29th session levels:
All listed levels: 612.47, 612.60, 612.79, 612.96, 613.24, 613.63, 614.79
Resistance above: 612.79, 612.96, 613.24, 613.63, 614.79
Support below: 612.60, 612.47
Nearest pivot: 612.79
Above 612.79 → 612.96 next
Lose 612.60 → 612.47 next
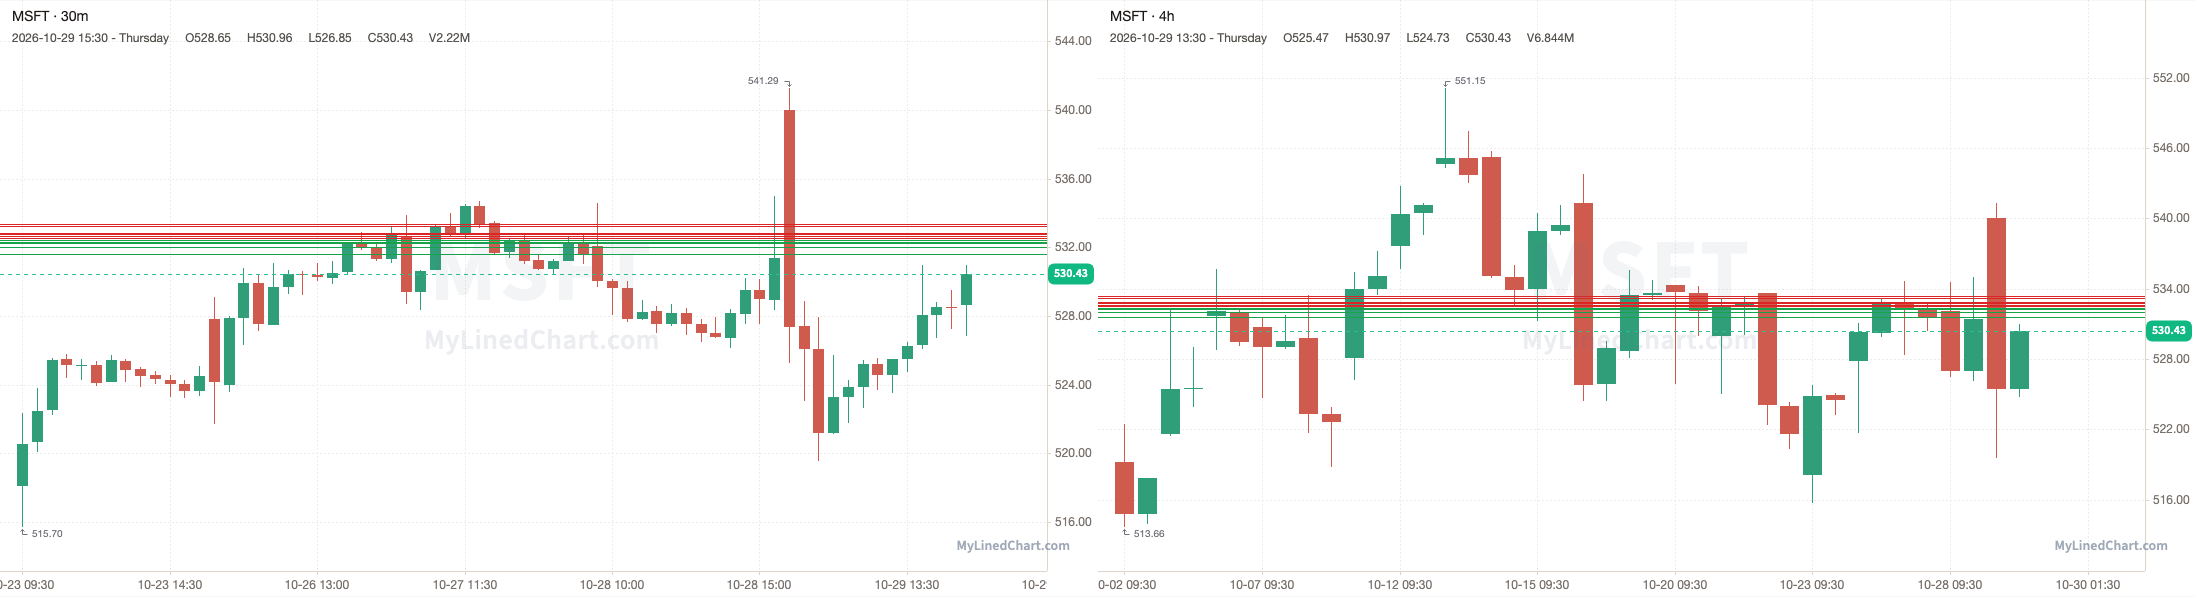
MSFT (Microsoft)
MSFT opened at 540.01, broke below the 532.40 pivot and ran through every support level down to 531.59, and kept going to a low of 519.56, then ended up closing at 530.43. Finishing the trading session down 1.77% intraday and down 0.37% overall.
October 29th session levels:
All listed levels: 531.59, 532.02, 532.24, 532.32, 532.40, 532.55, 532.65, 532.76, 532.83, 533.25, 533.38
Resistance above: 532.55, 532.65, 532.76, 532.83, 533.25, 533.38
Support below: 532.40, 532.32, 532.24, 532.02, 531.59
Nearest pivot: 532.40
Above 532.55 → 532.65 next
Lose 532.40 → 532.32 next
SMCI (Super Micro Computer)
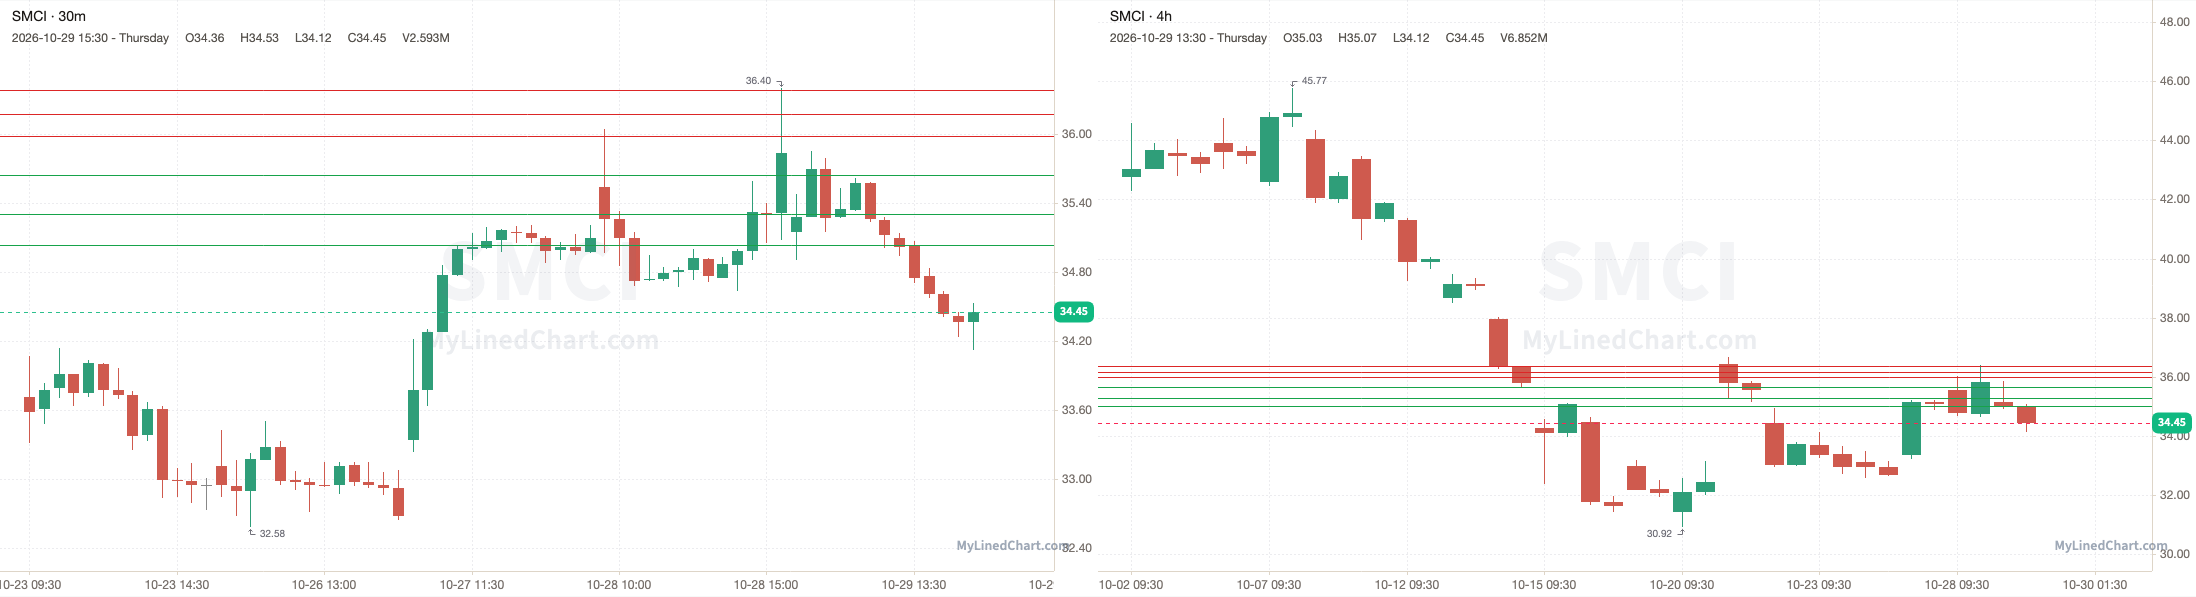
SMCI opened at 35.15, stayed under the 35.98 pivot and dropped to tag 35.03, with a low of 34.12, then ended up closing at 34.45. Finishing the trading session down 1.99% intraday and down 3.85% overall.
October 29th session levels:
All listed levels: 35.03, 35.30, 35.64, 35.98, 36.17, 36.38
Resistance above: 35.98, 36.17, 36.38
Support below: 35.64, 35.30, 35.03
Nearest pivot: 35.98
Above 35.98 → 36.17 next
Lose 35.64 → 35.30 next
HOOD (Robinhood)
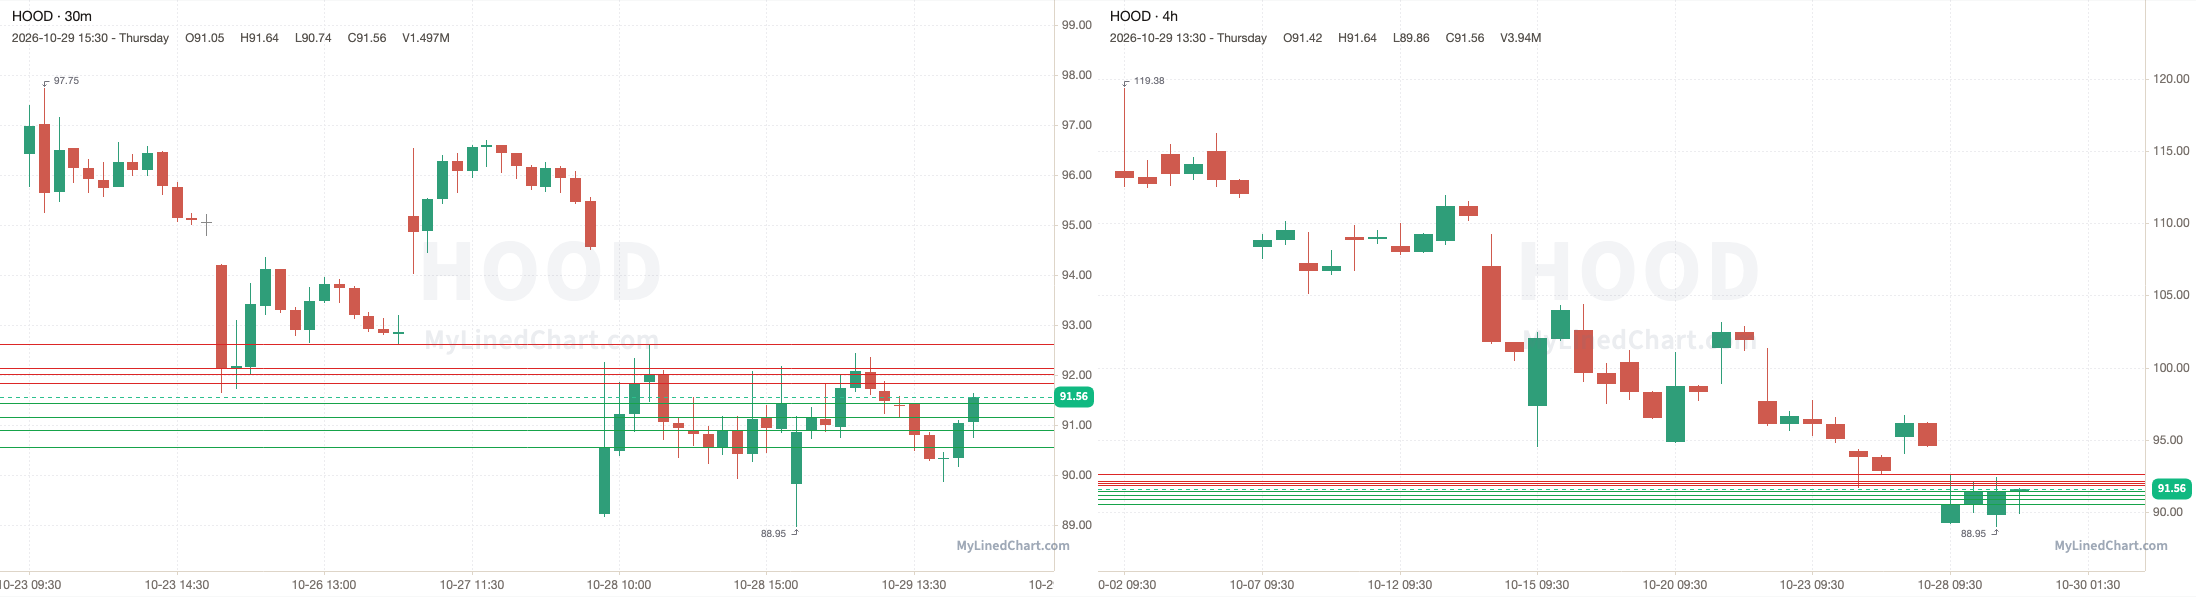
HOOD opened at 89.82, broke above the 91.43 pivot and ran up to tag 92.13, with a high of 92.44, then ended up closing at 91.56. Finishing the trading session up 1.94% intraday and up 0.13% overall.
October 29th session levels:
All listed levels: 90.55, 90.89, 91.16, 91.43, 91.84, 92.02, 92.13, 92.61
Resistance above: 91.84, 92.02, 92.13, 92.61
Support below: 91.43, 91.16, 90.89, 90.55
Nearest pivot: 91.43
Above 91.84 → 92.02 next
Lose 91.43 → 91.16 next
MARA (MARA Holdings)
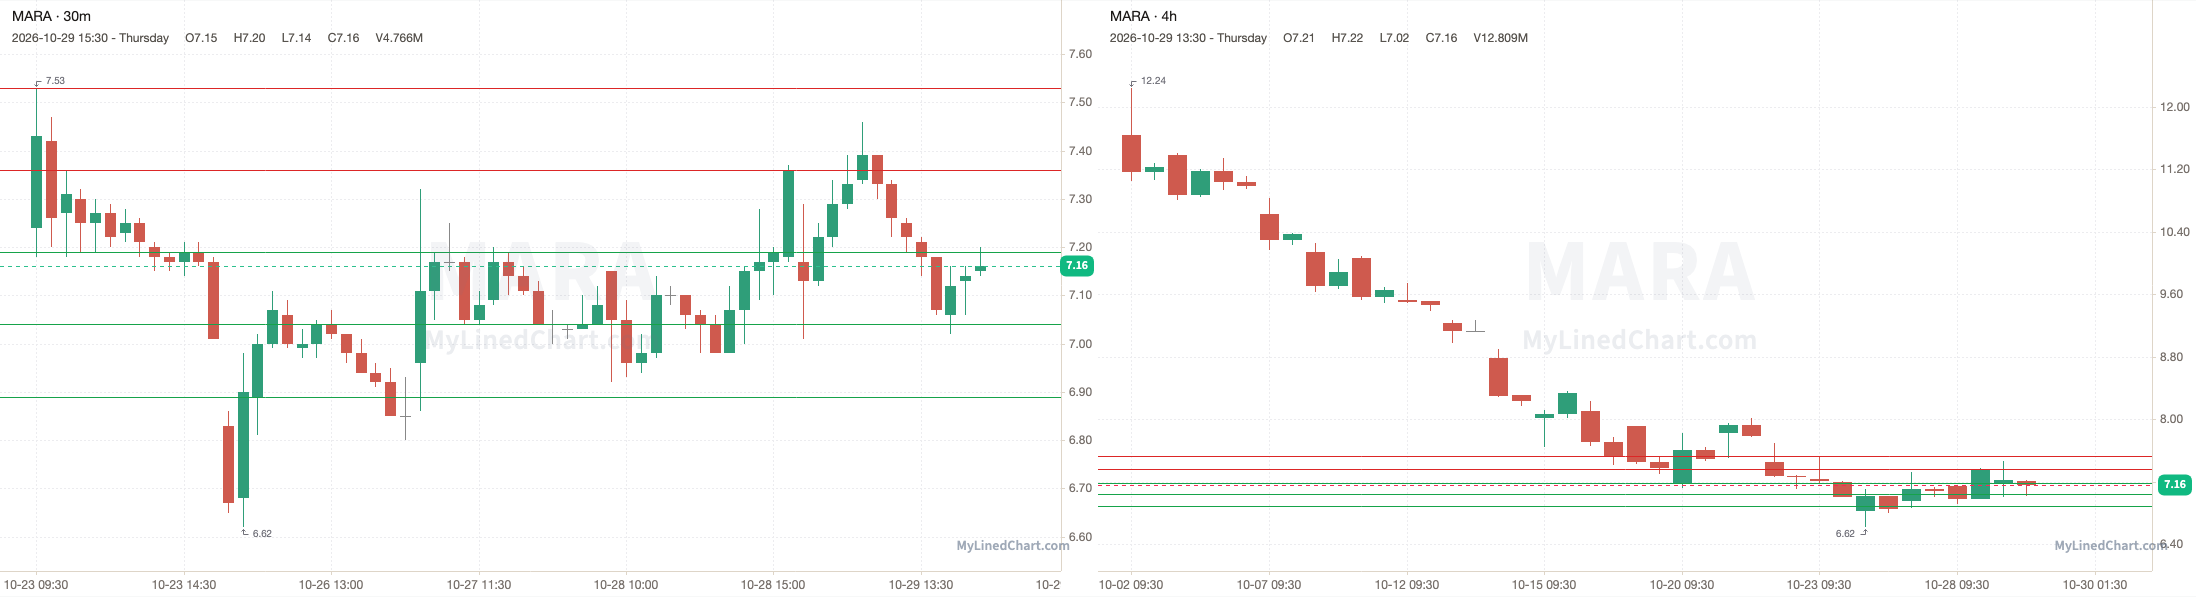
MARA opened at 7.17, popped above the 7.36 pivot to a high of 7.46, then lost it and dropped to tag 7.04, with a low of 7.01, then ended up closing at 7.16. Finishing the trading session down 0.14% intraday and down 2.72% overall.
October 29th session levels:
All listed levels: 6.89, 7.04, 7.19, 7.36, 7.53
Resistance above: 7.53
Support below: 7.19, 7.04, 6.89
Nearest pivot: 7.36
Above 7.53 → open air
Lose 7.19 → 7.04 next
GME (GameStop)
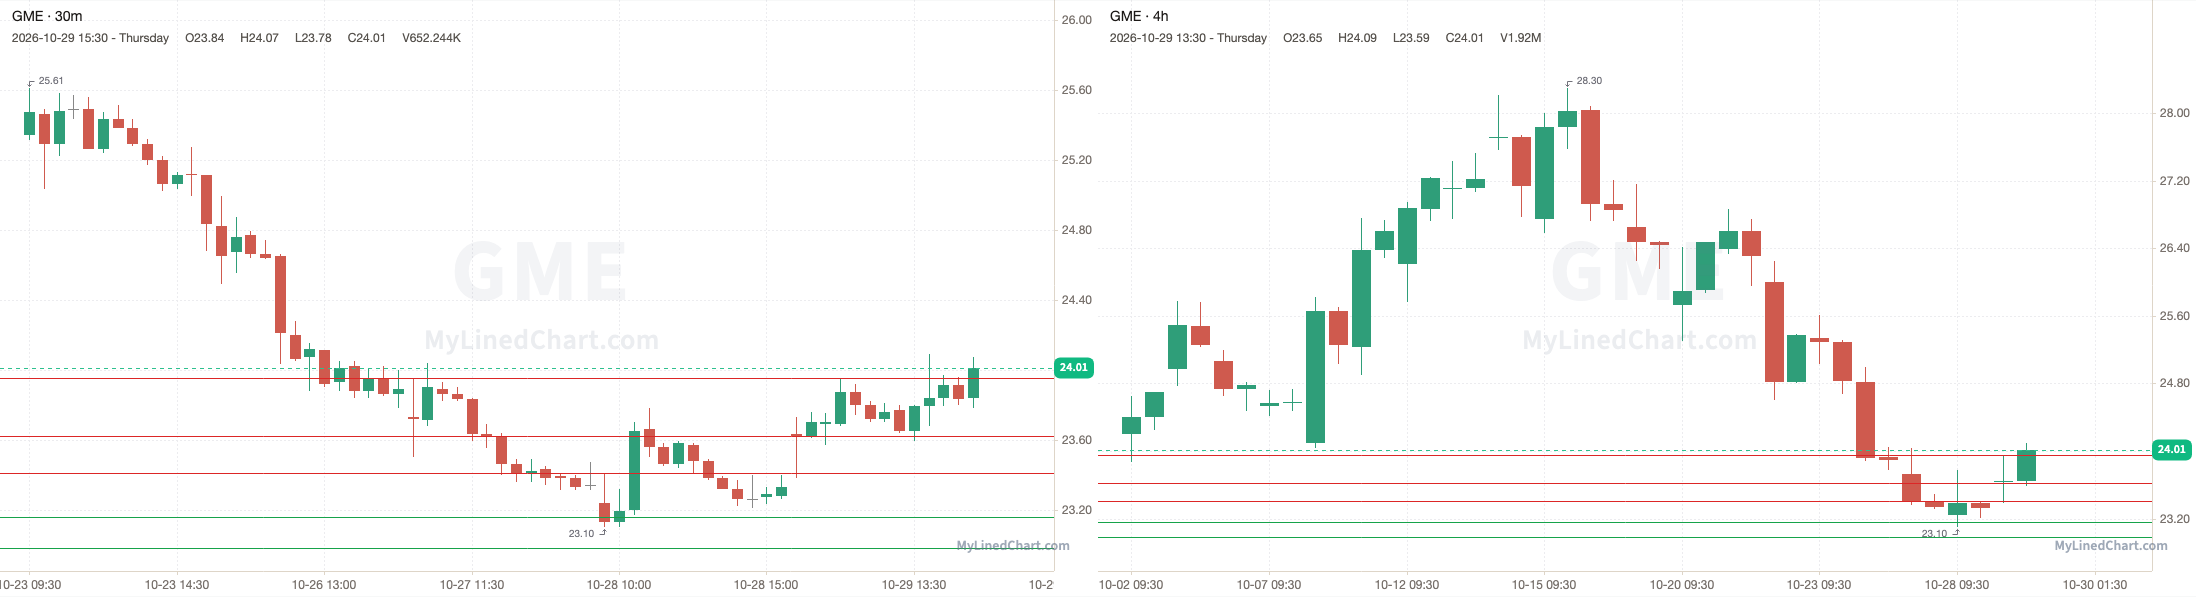
GME opened at 23.63, dipped below the 23.41 pivot to a low of 23.38, then reclaimed it and ran up to tag 23.95, with a high of 24.09, then ended up closing at 24.01. Finishing the trading session up 1.61% intraday and up 2.87% overall.
October 29th session levels:
All listed levels: 22.98, 23.16, 23.41, 23.62, 23.95
Resistance above: 23.41, 23.62, 23.95
Support below: 23.16, 22.98
Nearest pivot: 23.41
Above 23.41 → 23.62 next
Lose 23.16 → 22.98 next
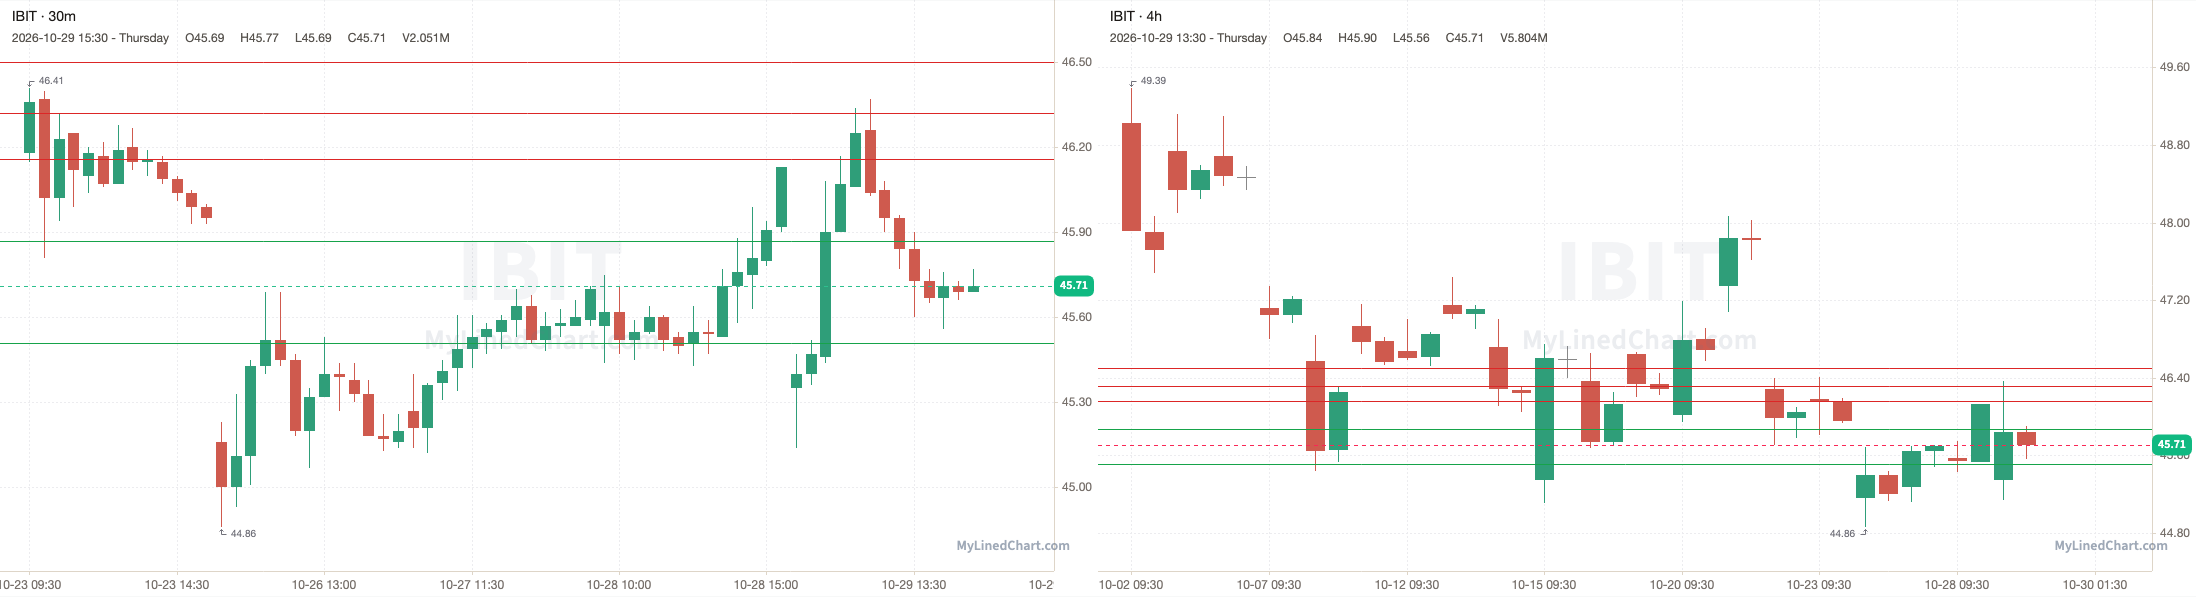
IBIT (iShares Bitcoin Trust)
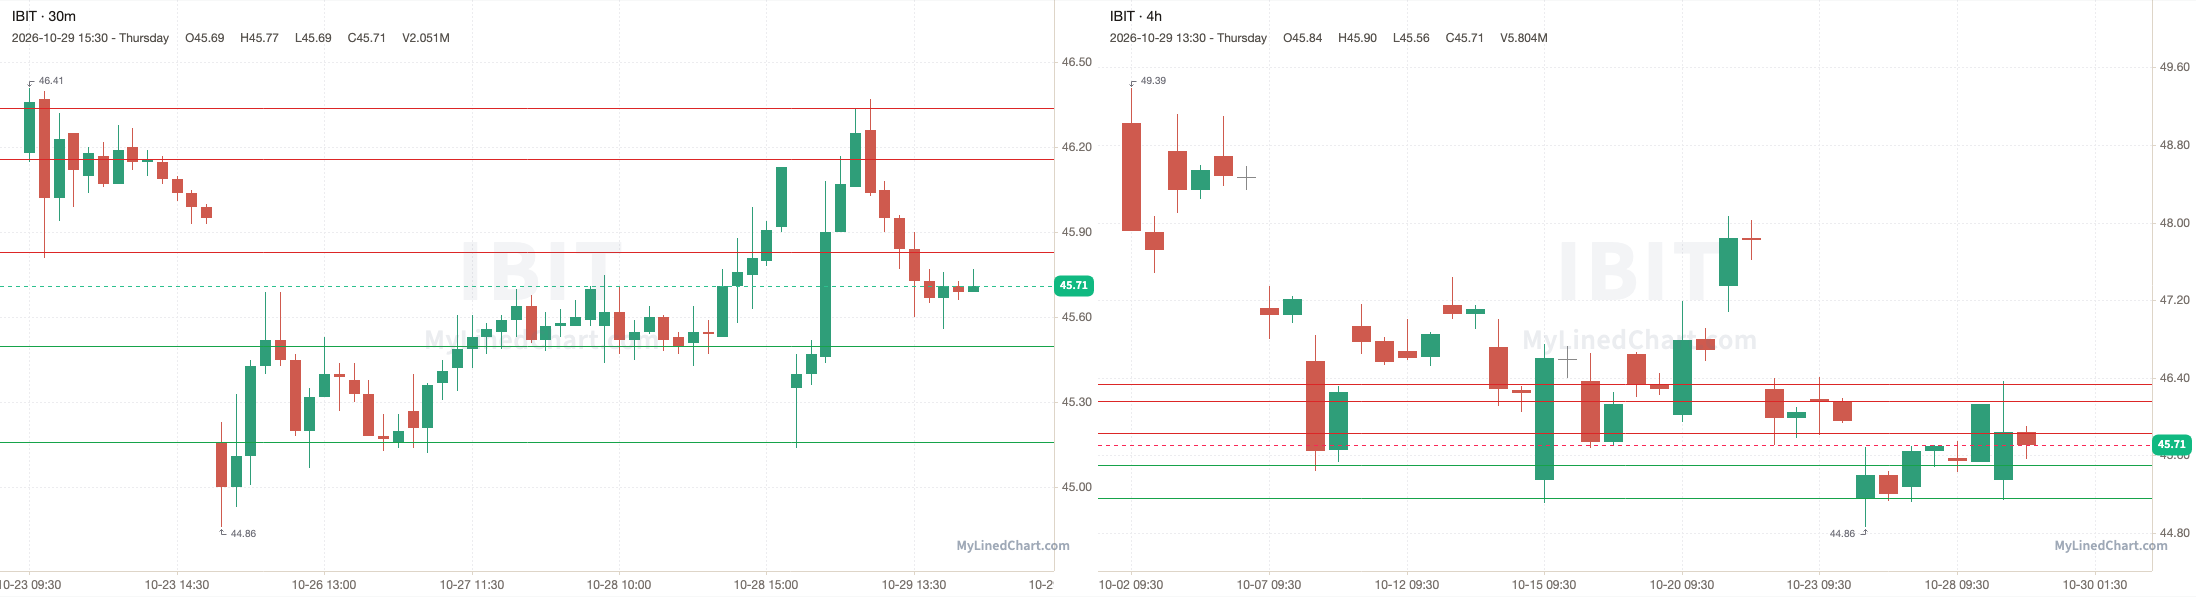
IBIT opened at 45.35, broke above the 46.16 pivot and ran up to tag 46.32, with a high of 46.37, then ended up closing at 45.71. Finishing the trading session up 0.79% intraday and down 0.91% overall.
October 29th session levels:
All listed levels: 45.51, 45.87, 46.16, 46.32, 46.50
Resistance above: 46.16, 46.32, 46.50
Support below: 45.87, 45.51
Nearest pivot: 46.16
Above 46.16 → 46.32 next
Lose 45.87 → 45.51 next
ETHA (iShares Ethereum Trust)
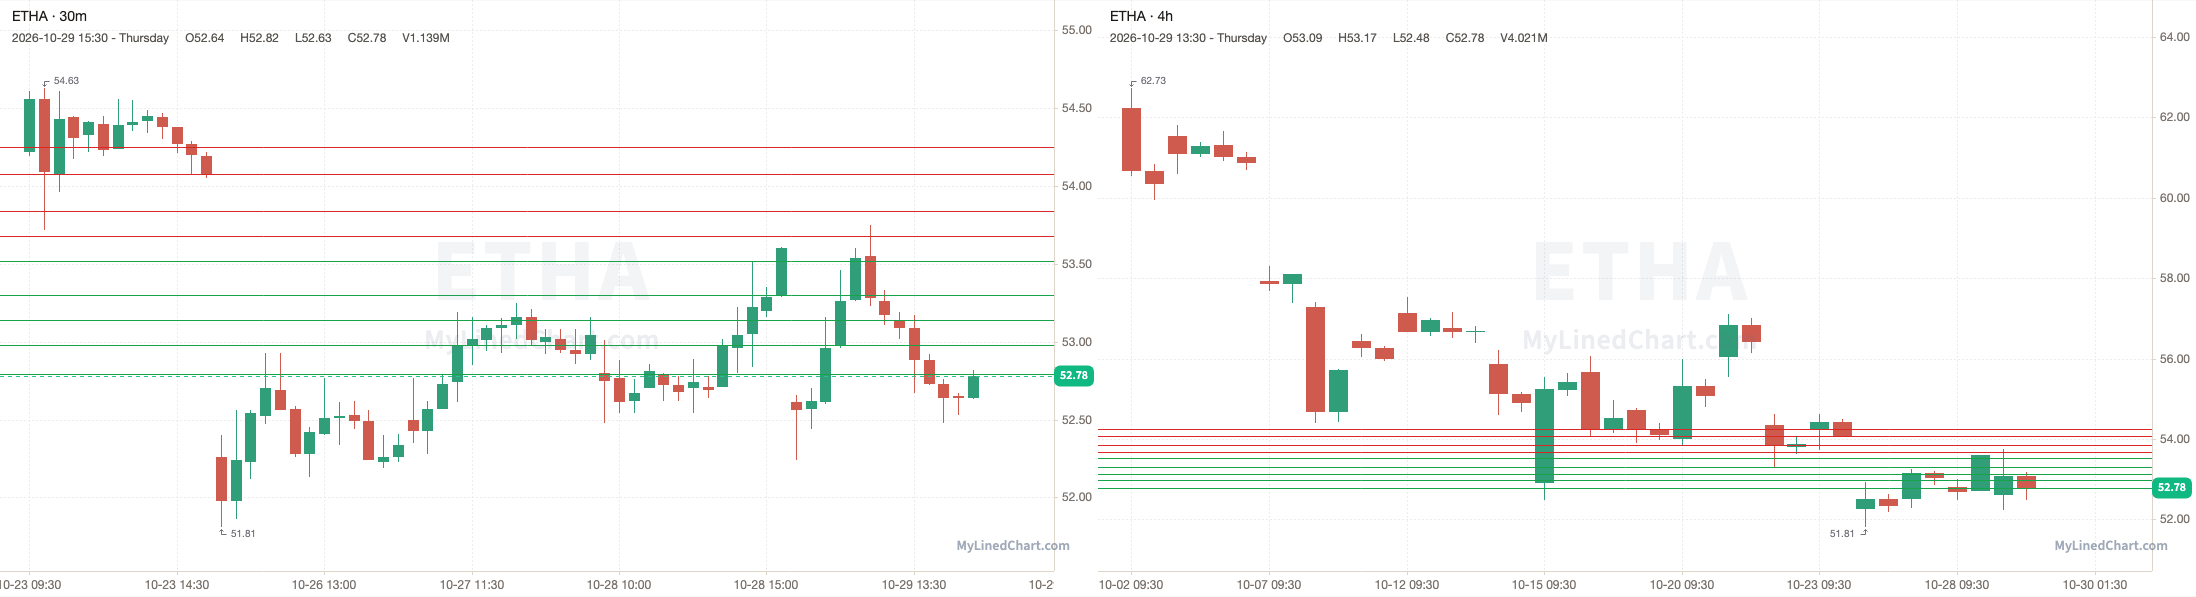
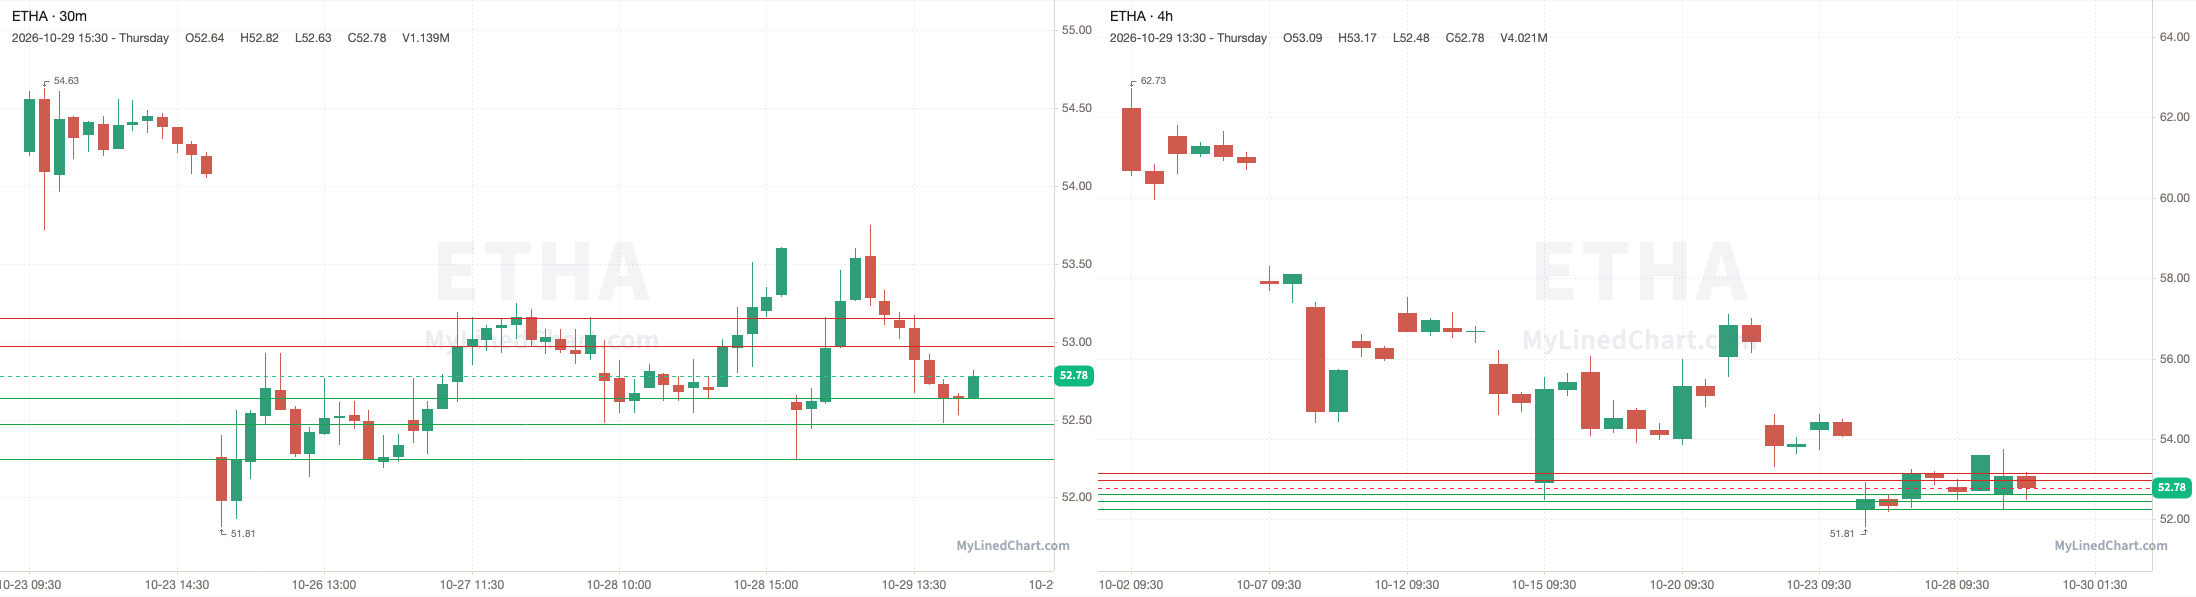
ETHA opened at 52.61, broke above the 53.52 pivot and ran up to tag 53.68, with a high of 53.75, then ended up closing at 52.78. Finishing the trading session up 0.32% intraday and down 1.51% overall.
October 29th session levels:
All listed levels: 52.79, 52.98, 53.14, 53.30, 53.52, 53.68, 53.84, 54.08, 54.25
Resistance above: 53.68, 53.84, 54.08, 54.25
Support below: 53.52, 53.30, 53.14, 52.98, 52.79
Nearest pivot: 53.52
Above 53.68 → 53.84 next
Lose 53.52 → 53.30 next
INTC (Intel)
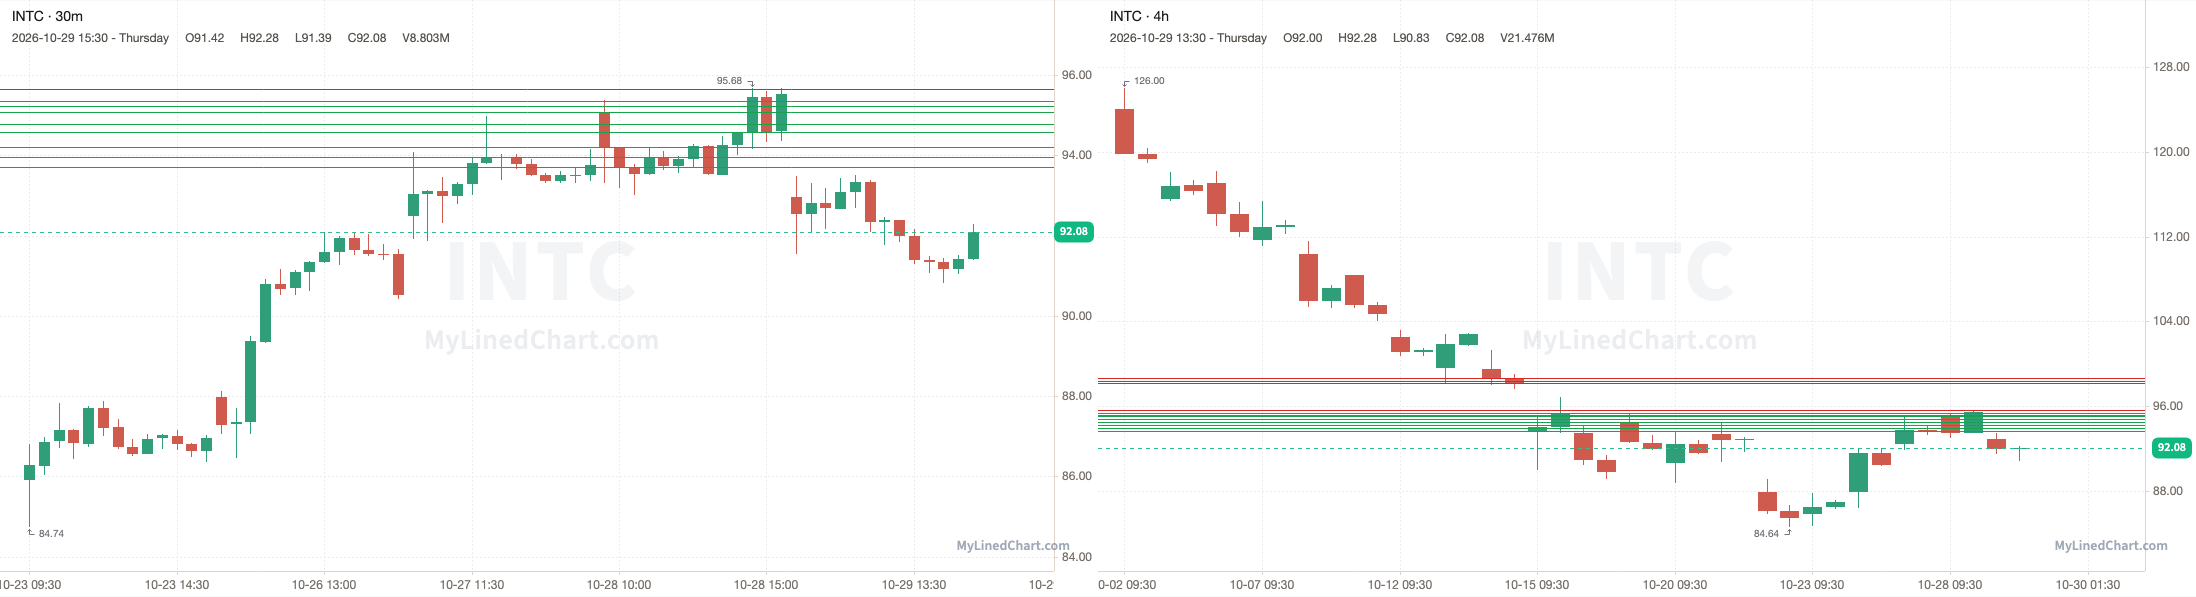
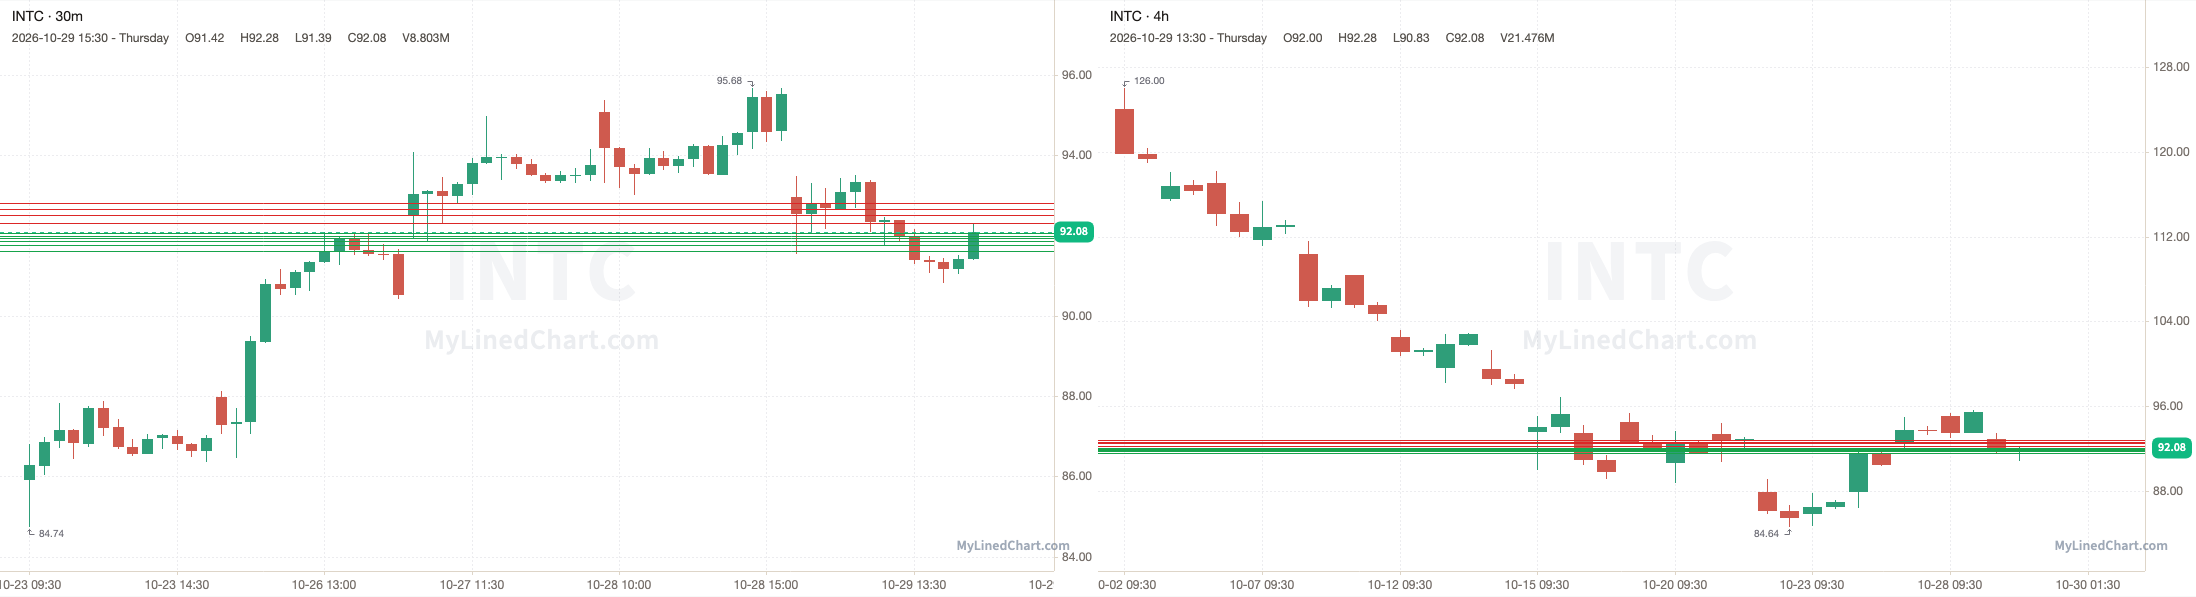
INTC opened at 92.97, under the 95.64 pivot and every level in the plan, and never traded back up to them, with a high of 93.50 and a low of 90.83, then ended up closing at 92.08. Finishing the trading session down 0.96% intraday and down 3.64% overall.
October 29th session levels:
All listed levels: 93.72, 93.96, 94.21, 94.58, 94.78, 95.09, 95.23, 95.35, 95.64, 98.21, 98.43, 98.64
Resistance above: 95.64, 98.21, 98.43, 98.64
Support below: 95.35, 95.23, 95.09, 94.78, 94.58, 94.21, 93.96, 93.72
Nearest pivot: 95.64
Above 95.64 → 98.21 next
Lose 95.35 → 95.23 next
RIVN (Rivian)
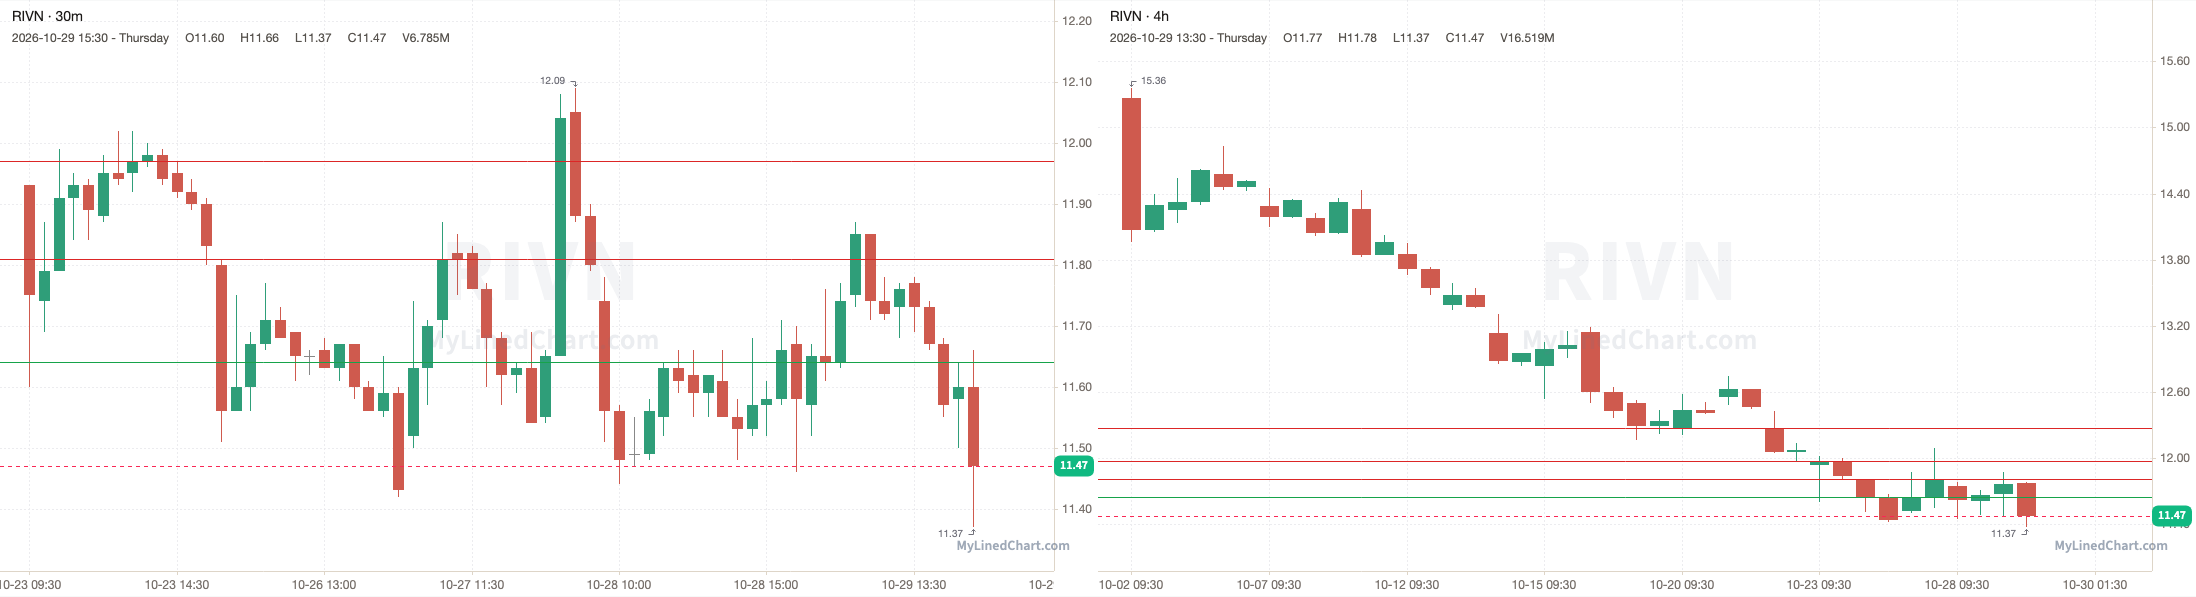
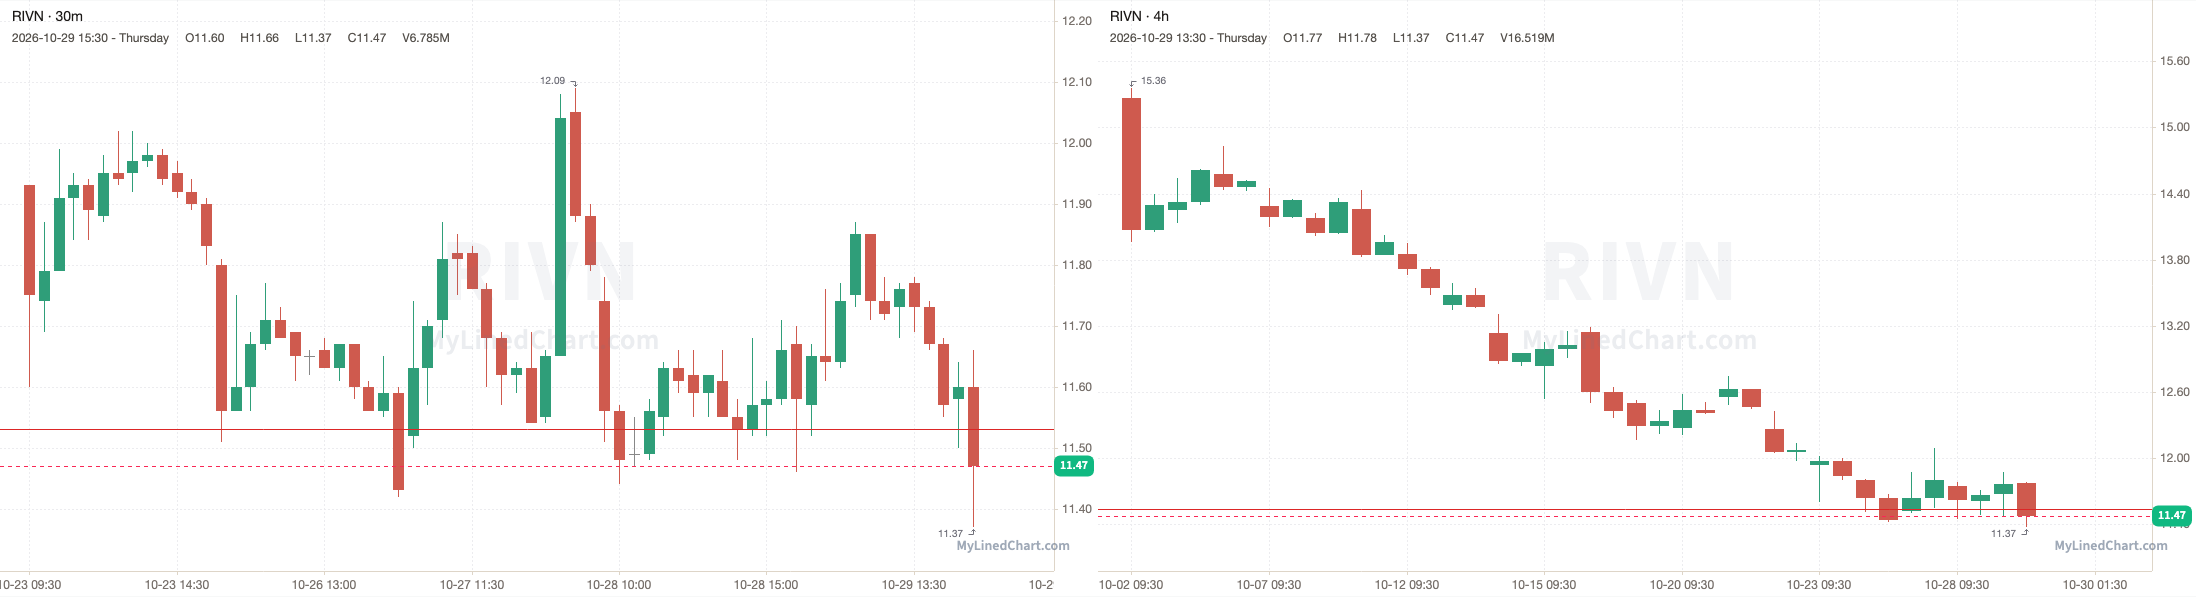
RIVN opened at 11.67, broke below the 11.64 pivot and dropped to a low of 11.37, then ended up closing at 11.47. Finishing the trading session down 1.71% intraday and down 1.71% overall.
October 29th session levels:
All listed levels: 11.64, 11.81, 11.97, 12.27
Resistance above: 11.81, 11.97, 12.27
Support below: 11.64
Nearest pivot: 11.64
Above 11.81 → 11.97 next
Lose 11.64 → open air
Day Trade Levels for the October 30th Trading Session:
Day-trade levels for October 30th
BTC and ETH use normal US market hours, 9:30 AM to 4:00 PM ET.
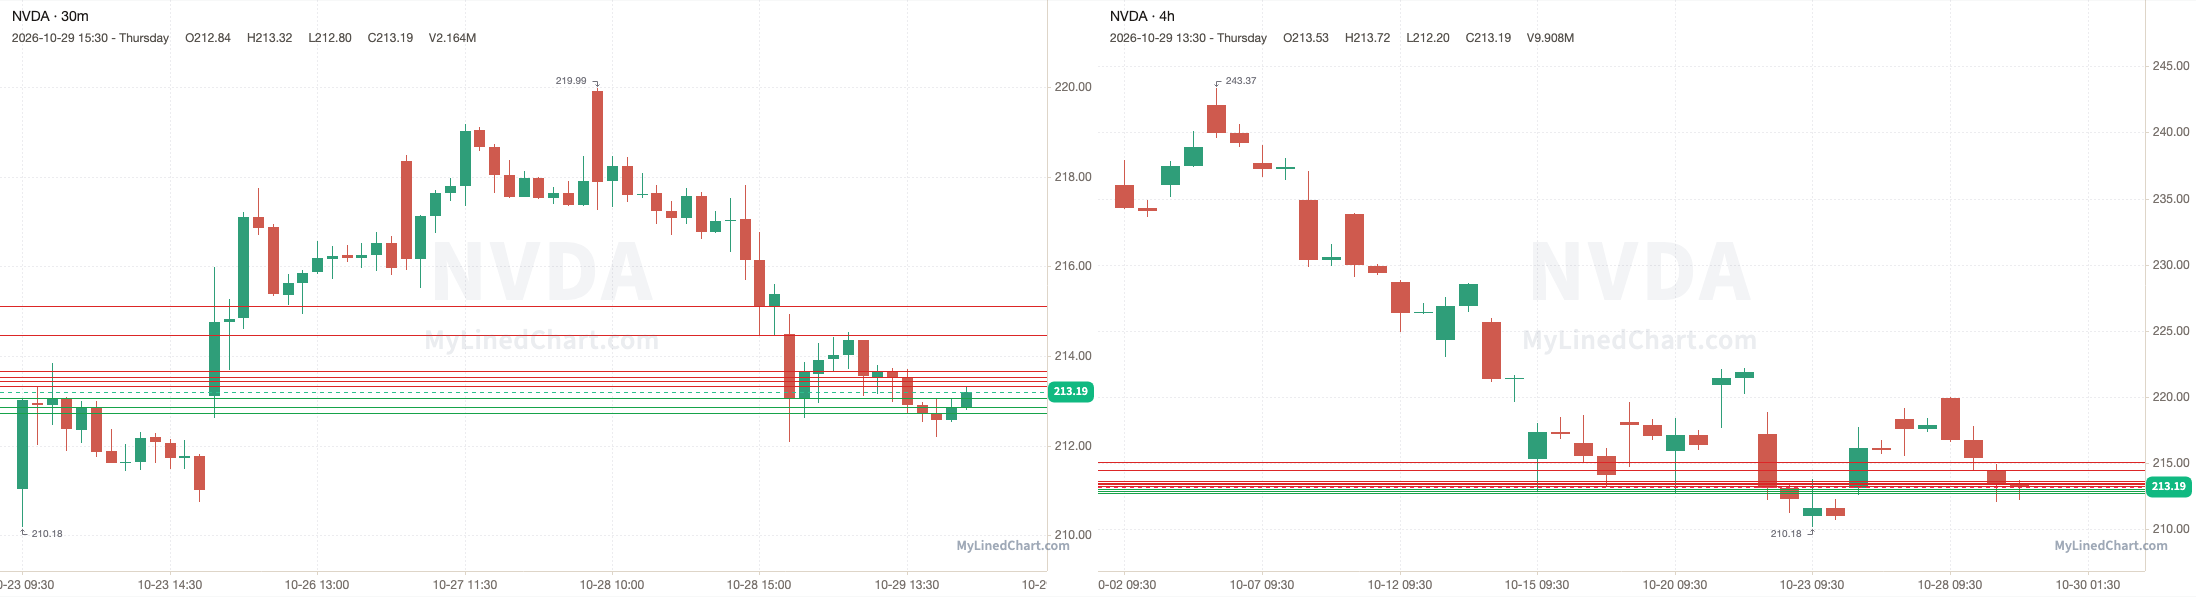
NVDA (NVIDIA)
Nearest pivot: 213.07
Above 213.32 → 213.45 next
Above 213.45 → 213.54 next
Above 213.54 → 213.67 next
Above 213.67 → 214.47 next
Above 214.47 → 215.12 next
Above 215.12 → open air
Lose 213.07 → 212.87 next
Lose 212.87 → 212.72 next
Lose 212.72 → open air
TSLA (Tesla)
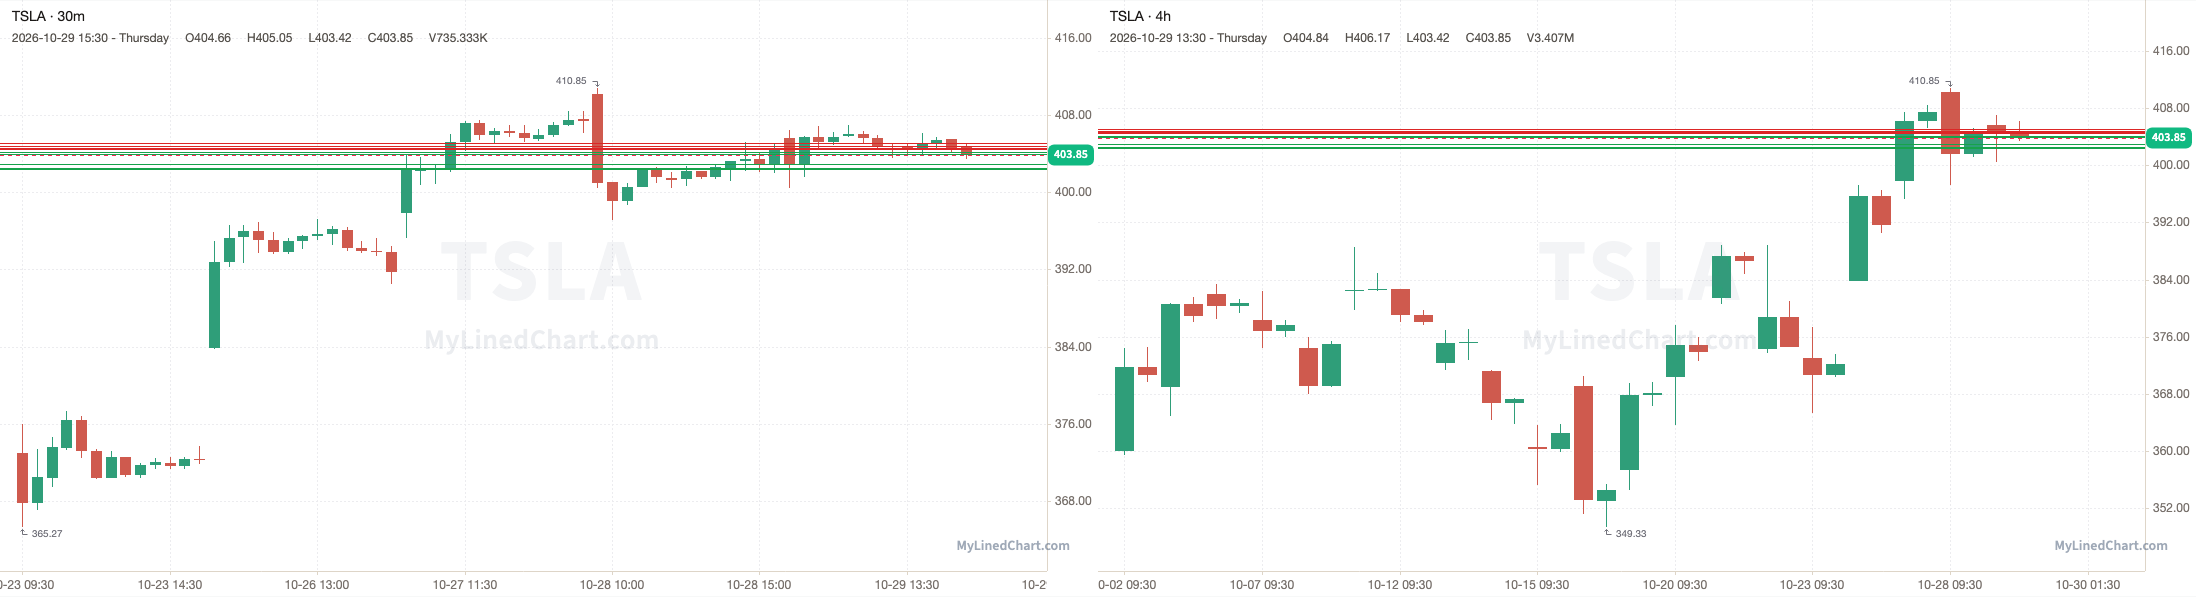
Nearest pivot: 404.17
Above 404.46 → 404.63 next
Above 404.63 → 404.83 next
Above 404.83 → 405.09 next
Above 405.09 → open air
Lose 404.17 → 403.99 next
Lose 403.99 → 402.93 next
Lose 402.93 → 402.51 next
Lose 402.51 → 402.38 next
Lose 402.38 → open air
BTC (Bitcoin)
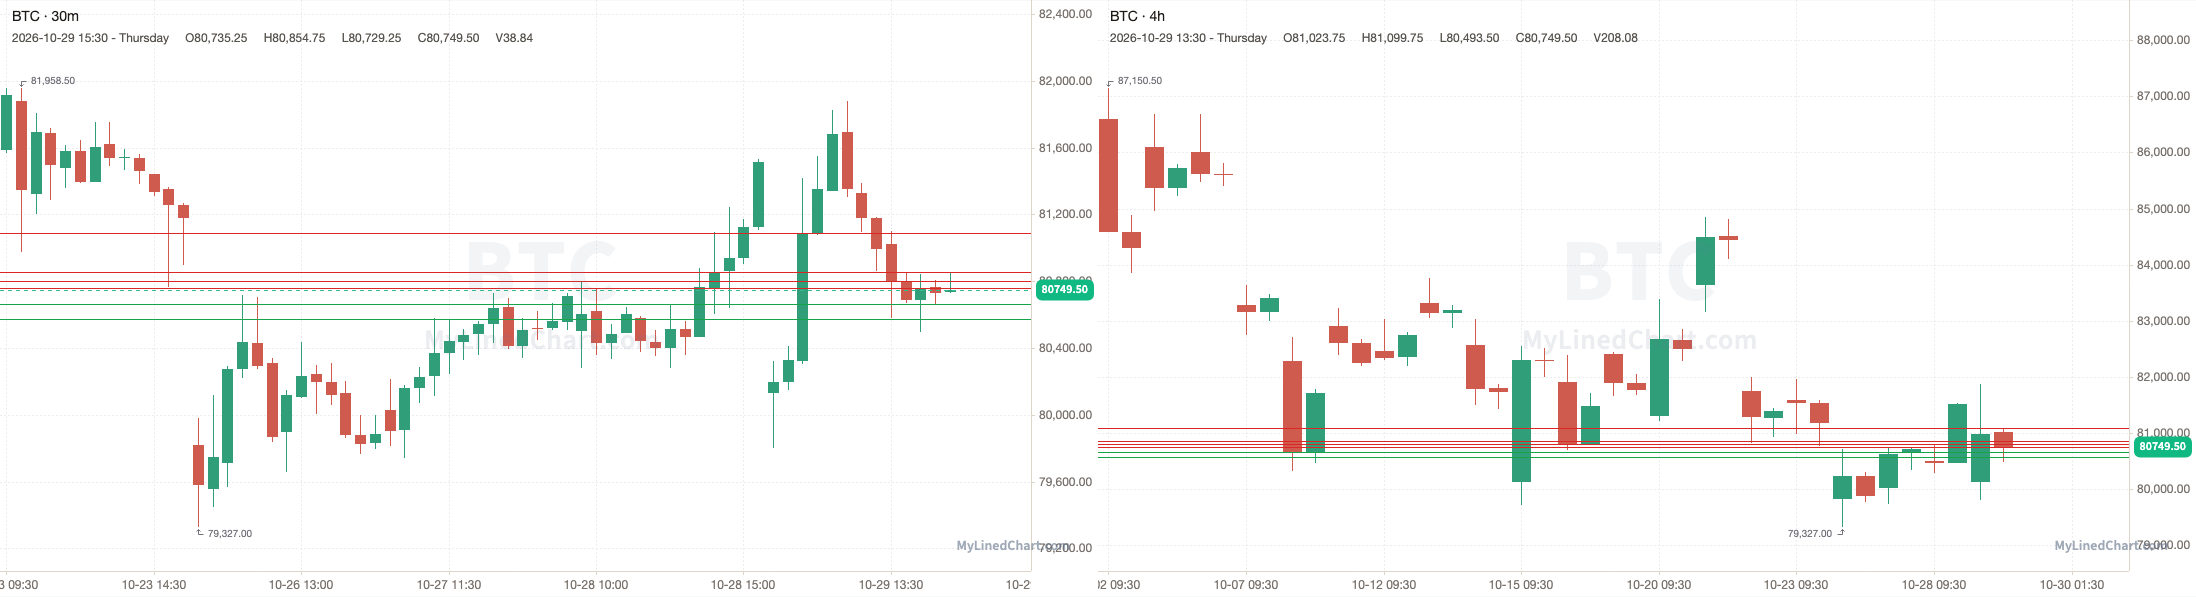
Nearest pivot: 80761.25
Above 80761.25 → 80801.75 next
Above 80801.75 → 80853.50 next
Above 80853.50 → 81091.25 next
Above 81091.25 → open air
Lose 80665.50 → 80572.50 next
Lose 80572.50 → open air
ETH (Ethereum)
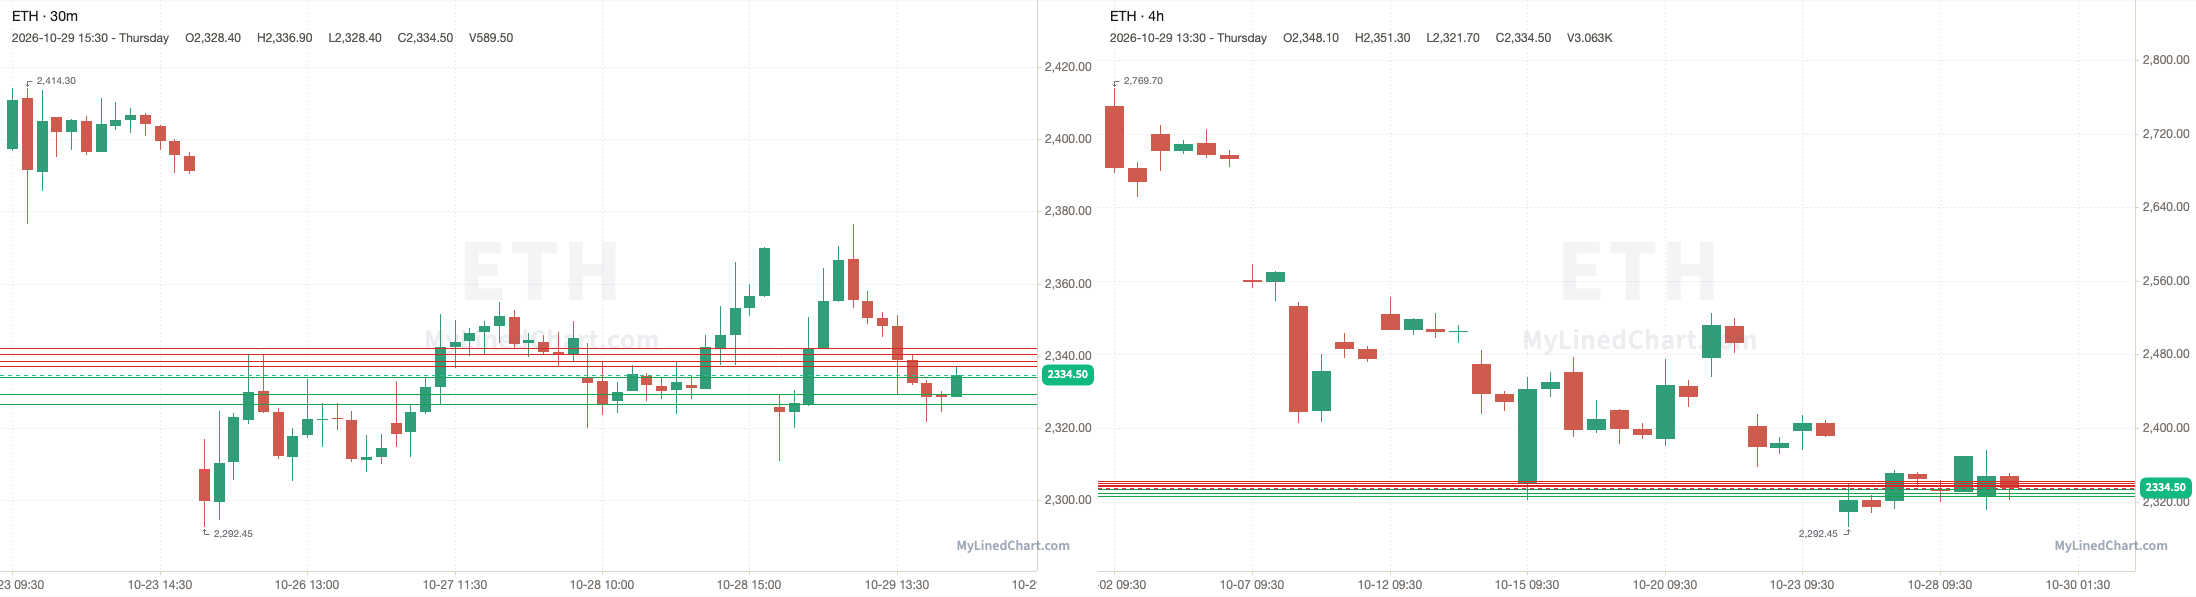
Nearest pivot: 2334
Above 2337.10 → 2338.60 next
Above 2338.60 → 2340.40 next
Above 2340.40 → 2342.20 next
Above 2342.20 → open air
Lose 2334 → 2329.35 next
Lose 2329.35 → 2326.55 next
Lose 2326.55 → open air
GLD (SPDR Gold Shares)
Nearest pivot: 368.63
Above 368.63 → 368.85 next
Above 368.85 → 369.28 next
Above 369.28 → 369.93 next
Above 369.93 → open air
Lose 368.46 → 368.30 next
Lose 368.30 → 368.23 next
Lose 368.23 → 368.09 next
Lose 368.09 → open air
SLV (iShares Silver Trust)
Nearest pivot: 47.23
Above 47.39 → 47.52 next
Above 47.52 → 48.10 next
Above 48.10 → 48.37 next
Above 48.37 → 48.53 next
Above 48.53 → 48.69 next
Above 48.69 → open air
Lose 47.23 → 46.98 next
Lose 46.98 → open air
CL (Crude Oil futures)
Nearest pivot: 102.88
Above 102.88 → 103.05 next
Above 103.05 → 103.35 next
Above 103.35 → open air
Lose 102.45 → 102.38 next
Lose 102.38 → open air
GC (Gold futures)
Nearest pivot: 4035
Above 4035 → open air
Lose 4027 → 4021.70 next
Lose 4021.70 → 4016.30 next
Lose 4016.30 → open air
AMD (Advanced Micro Devices)
Nearest pivot: 566.72
Above 566.72 → 567.10 next
Above 567.10 → 567.28 next
Above 567.28 → 567.97 next
Above 567.97 → 568.53 next
Above 568.53 → 571.78 next
Above 571.78 → open air
Lose 566.10 → 564.77 next
Lose 564.77 → 563.56 next
Lose 563.56 → 559.02 next
Lose 559.02 → open air
MSTR (Strategy)
Nearest pivot: 141.54
Above 141.54 → 141.71 next
Above 141.71 → 141.99 next
Above 141.99 → 142.23 next
Above 142.23 → open air
Lose 141.26 → 140.99 next
Lose 140.99 → 140.80 next
Lose 140.80 → open air
AAPL (Apple)
Nearest pivot: 348.93
Above 349.26 → 349.77 next
Above 349.77 → 350.13 next
Above 350.13 → open air
Lose 348.93 → 348.34 next
Lose 348.34 → 348.24 next
Lose 348.24 → 347.94 next
Lose 347.94 → 347.78 next
Lose 347.78 → open air
PLTR (Palantir)
Nearest pivot: 196.43
Above 196.64 → 196.72 next
Above 196.72 → 196.82 next
Above 196.82 → 197.19 next
Above 197.19 → 197.51 next
Above 197.51 → 197.75 next
Above 197.75 → open air
Lose 196.43 → 196.21 next
Lose 196.21 → 196.07 next
Lose 196.07 → 195.90 next
Lose 195.90 → open air
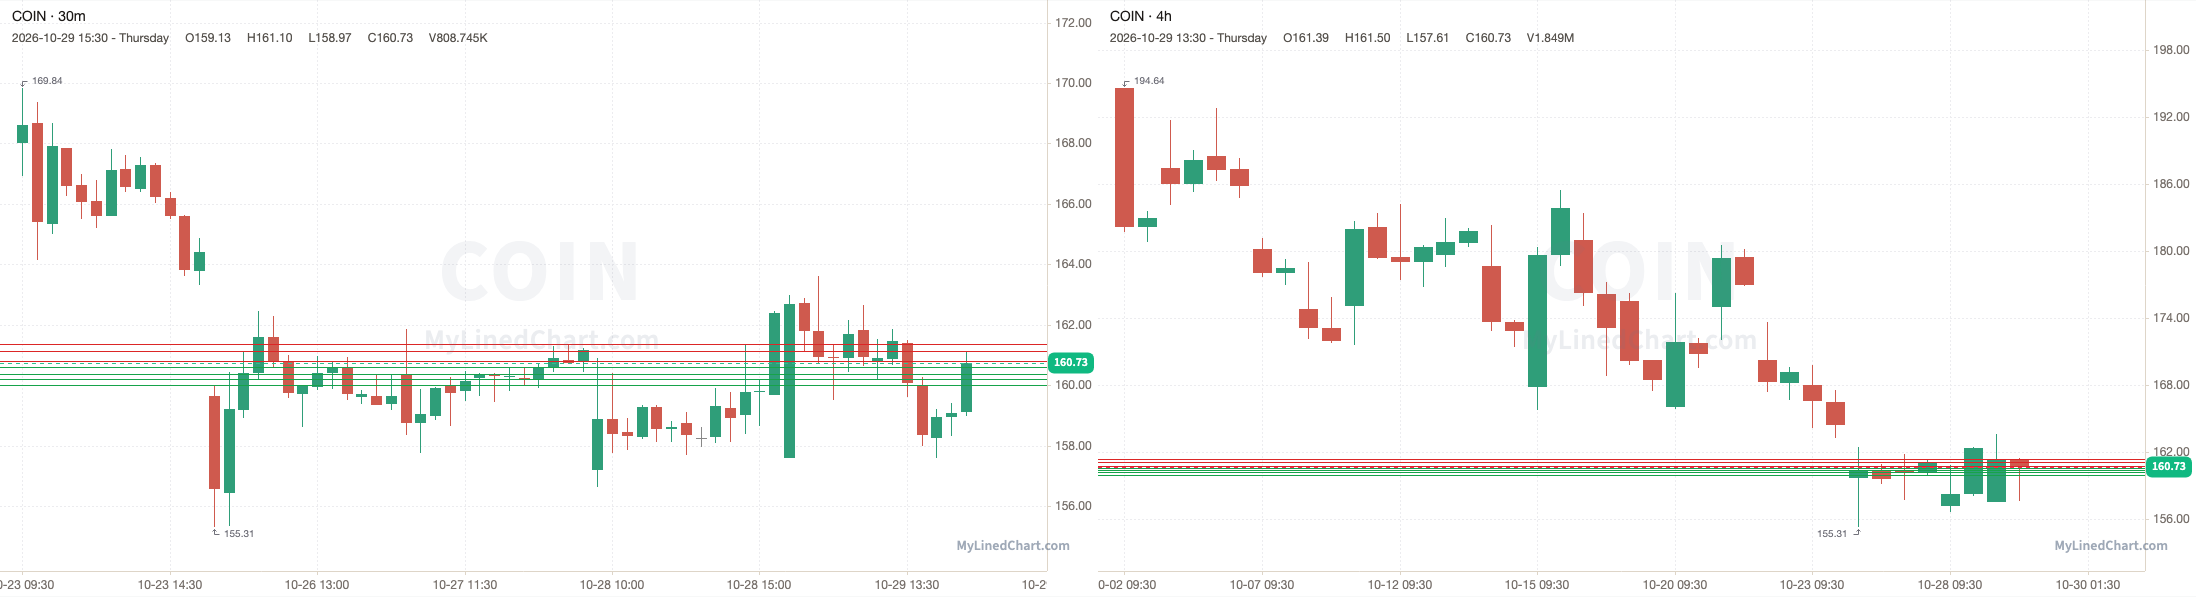
COIN (Coinbase)
Nearest pivot: 160.81
Above 160.81 → 161.13 next
Above 161.13 → 161.38 next
Above 161.38 → open air
Lose 160.61 → 160.39 next
Lose 160.39 → 160.22 next
Lose 160.22 → 160 next
Lose 160 → open air
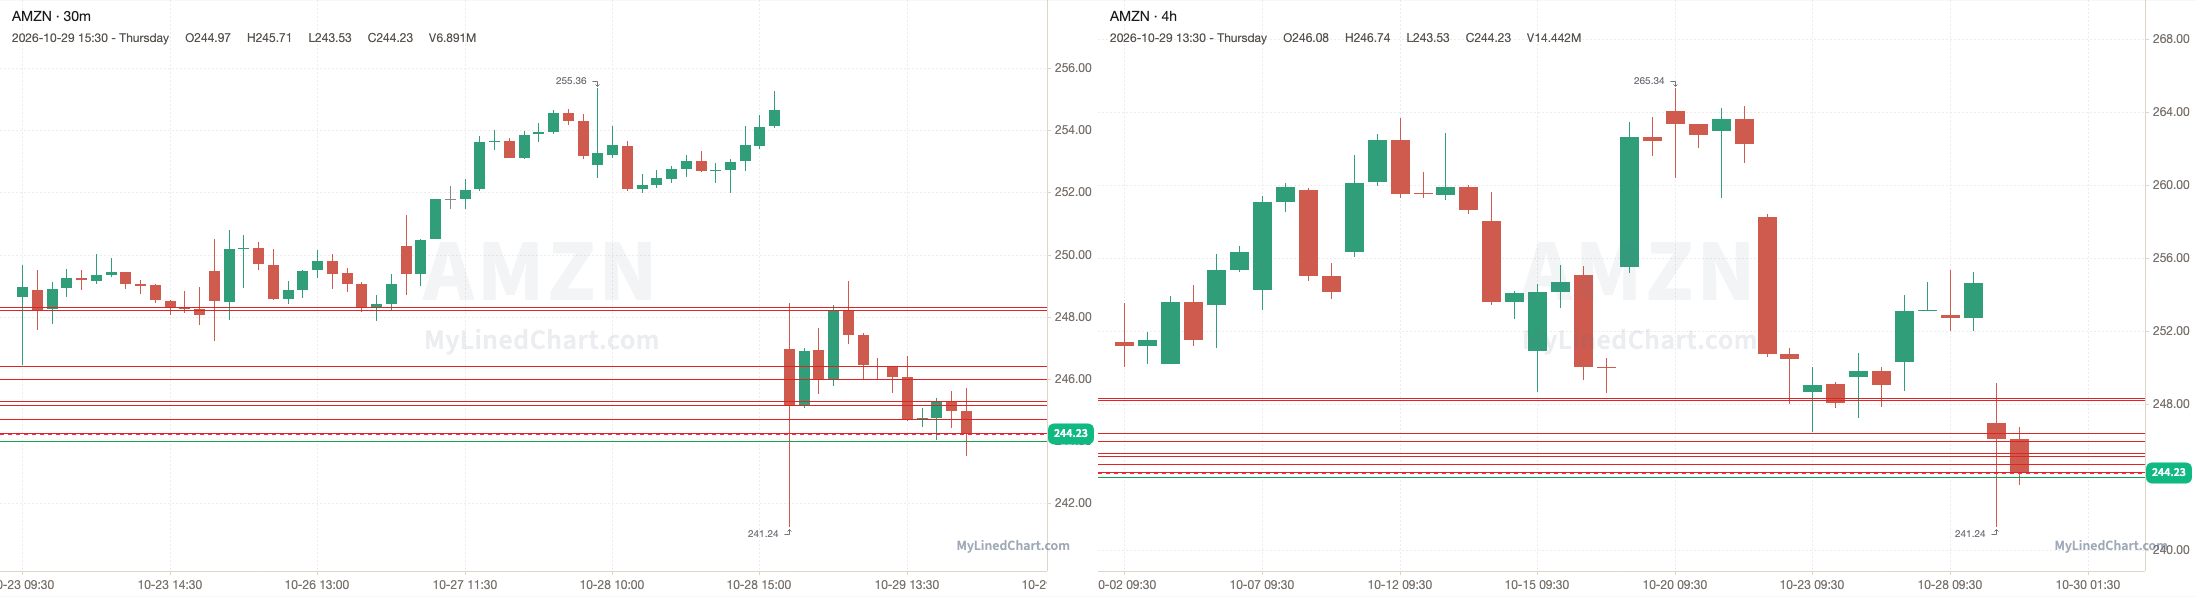
AMZN (Amazon)
Nearest pivot: 244.26
Above 244.26 → 244.71 next
Above 244.71 → 245.15 next
Above 245.15 → 245.29 next
Above 245.29 → 245.99 next
Above 245.99 → 246.42 next
Above 246.42 → 248.22 next
Above 248.22 → 248.31 next
Above 248.31 → open air
Lose 244.01 → open air
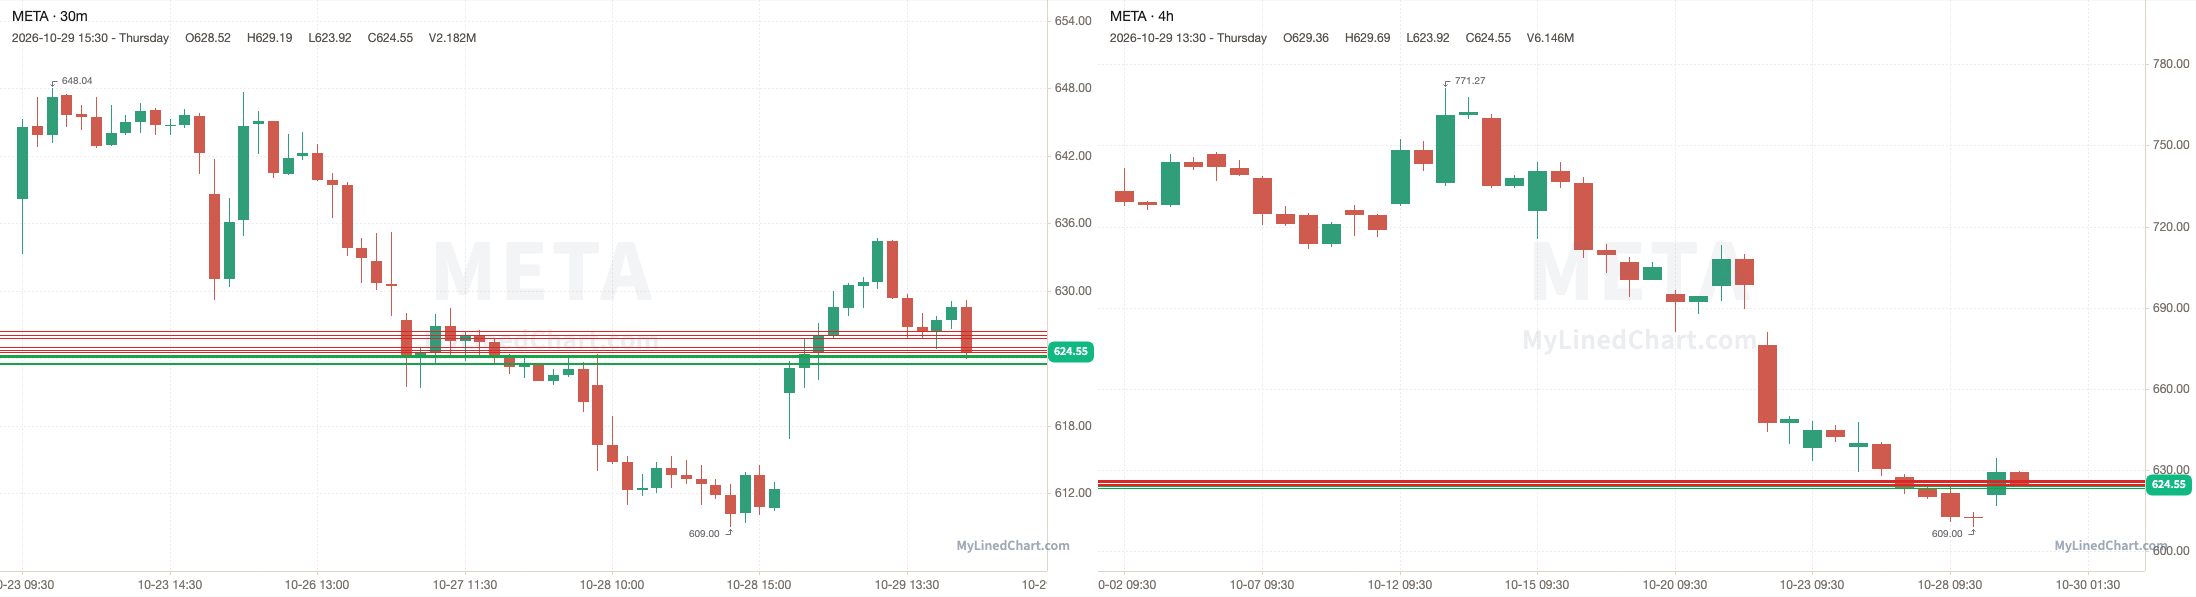
META (Meta Platforms)
Nearest pivot: 624.56
Above 624.56 → 624.78 next
Above 624.78 → 624.97 next
Above 624.97 → 625.80 next
Above 625.80 → 626.03 next
Above 626.03 → 626.44 next
Above 626.44 → open air
Lose 624.33 → 624.23 next
Lose 624.23 → 624.11 next
Lose 624.11 → 623.61 next
Lose 623.61 → 623.50 next
Lose 623.50 → open air
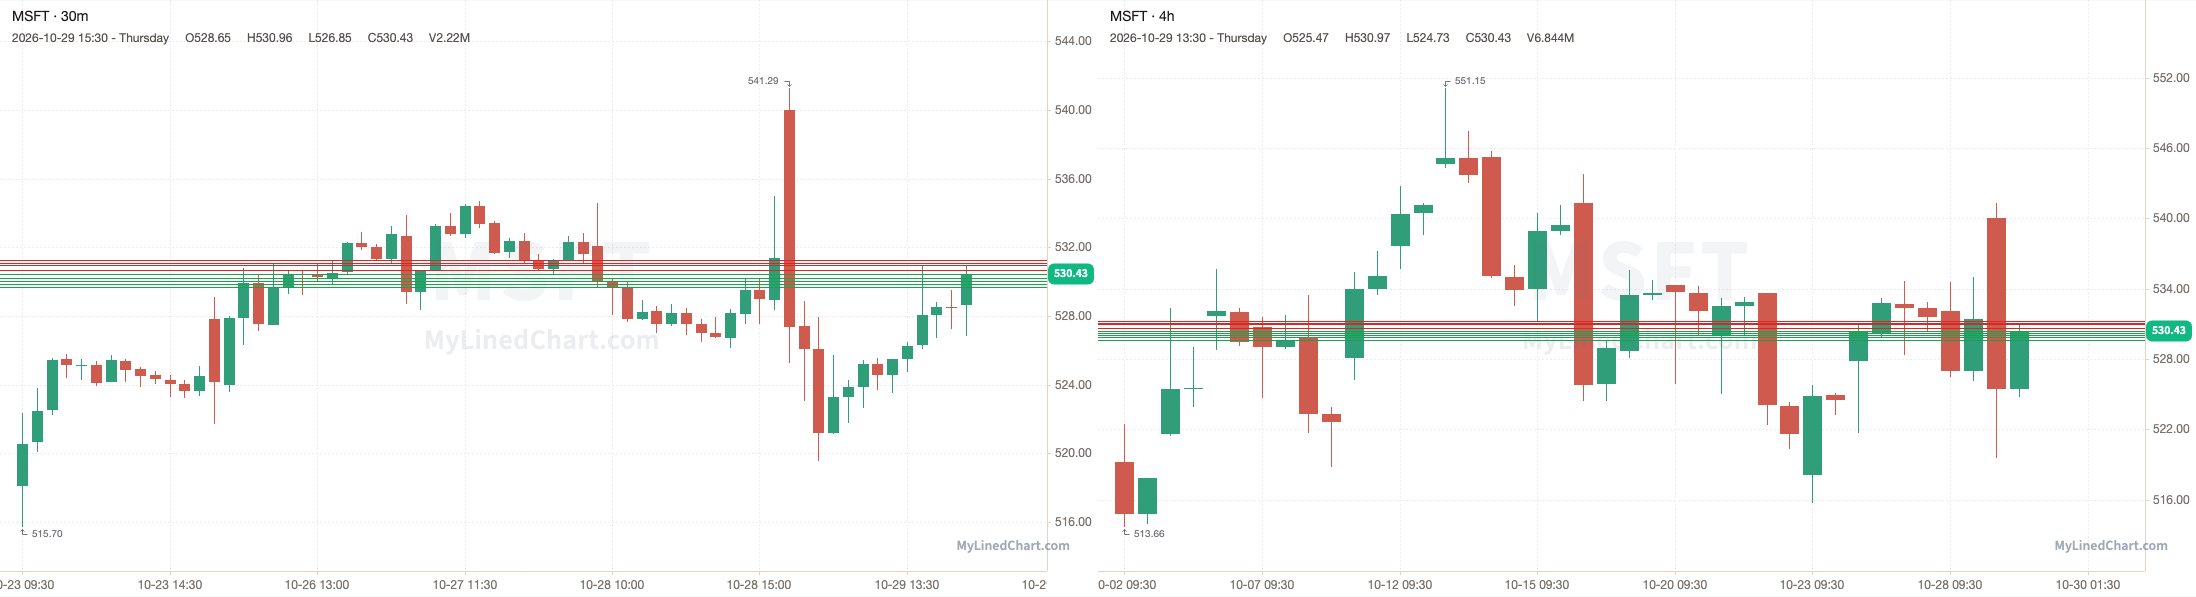
MSFT (Microsoft)
Nearest pivot: 530.42
Above 530.69 → 530.99 next
Above 530.99 → 531.09 next
Above 531.09 → 531.26 next
Above 531.26 → open air
Lose 530.42 → 530.20 next
Lose 530.20 → 530.04 next
Lose 530.04 → 529.87 next
Lose 529.87 → 529.66 next
Lose 529.66 → open air
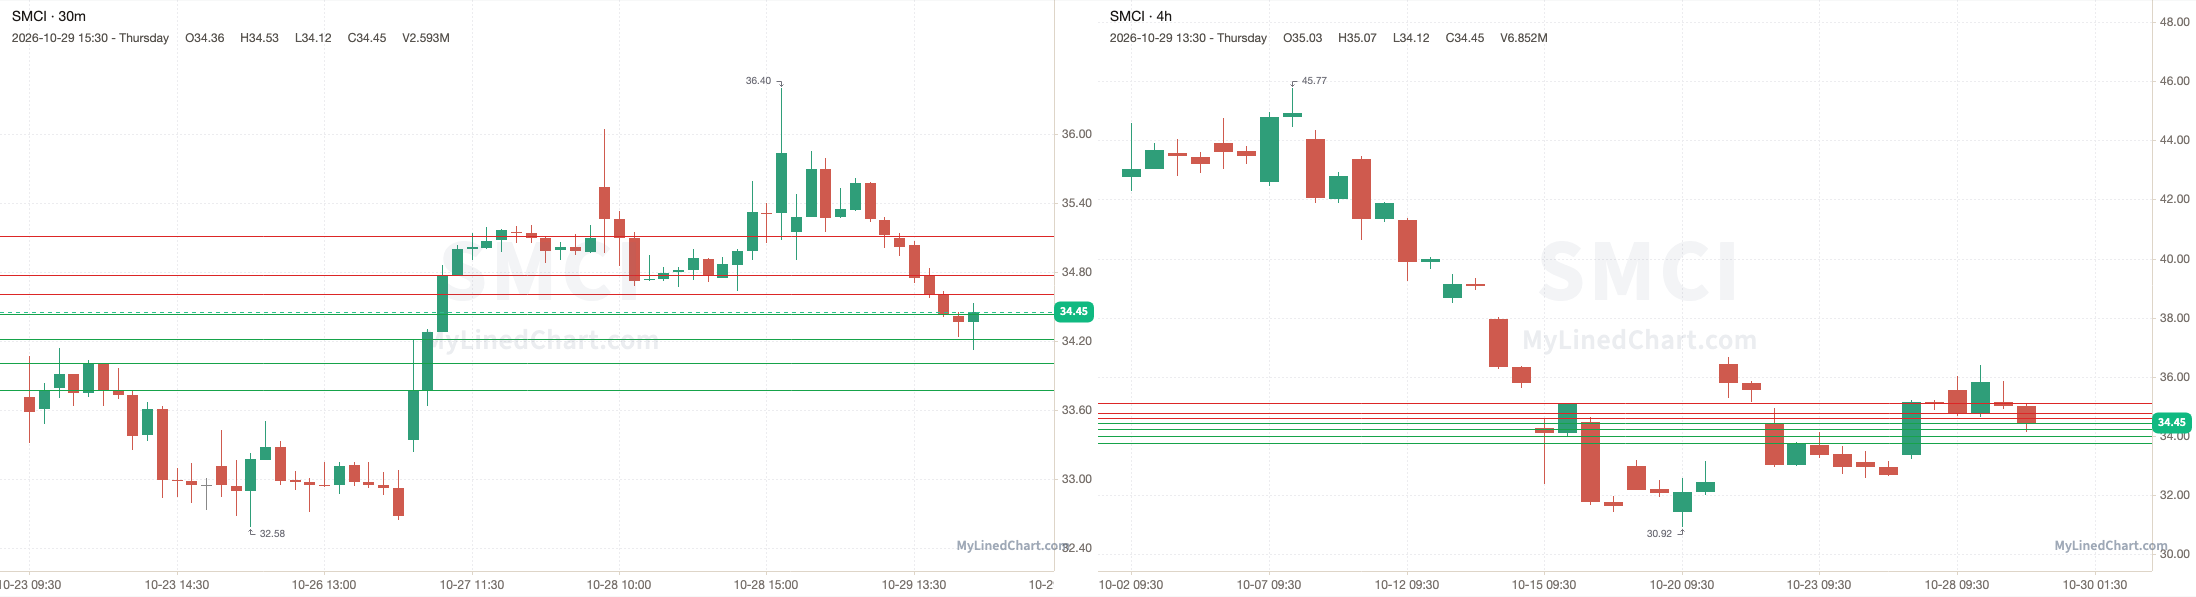
SMCI (Super Micro Computer)
Nearest pivot: 34.43
Above 34.61 → 34.77 next
Above 34.77 → 35.11 next
Above 35.11 → open air
Lose 34.43 → 34.22 next
Lose 34.22 → 34.01 next
Lose 34.01 → 33.77 next
Lose 33.77 → open air
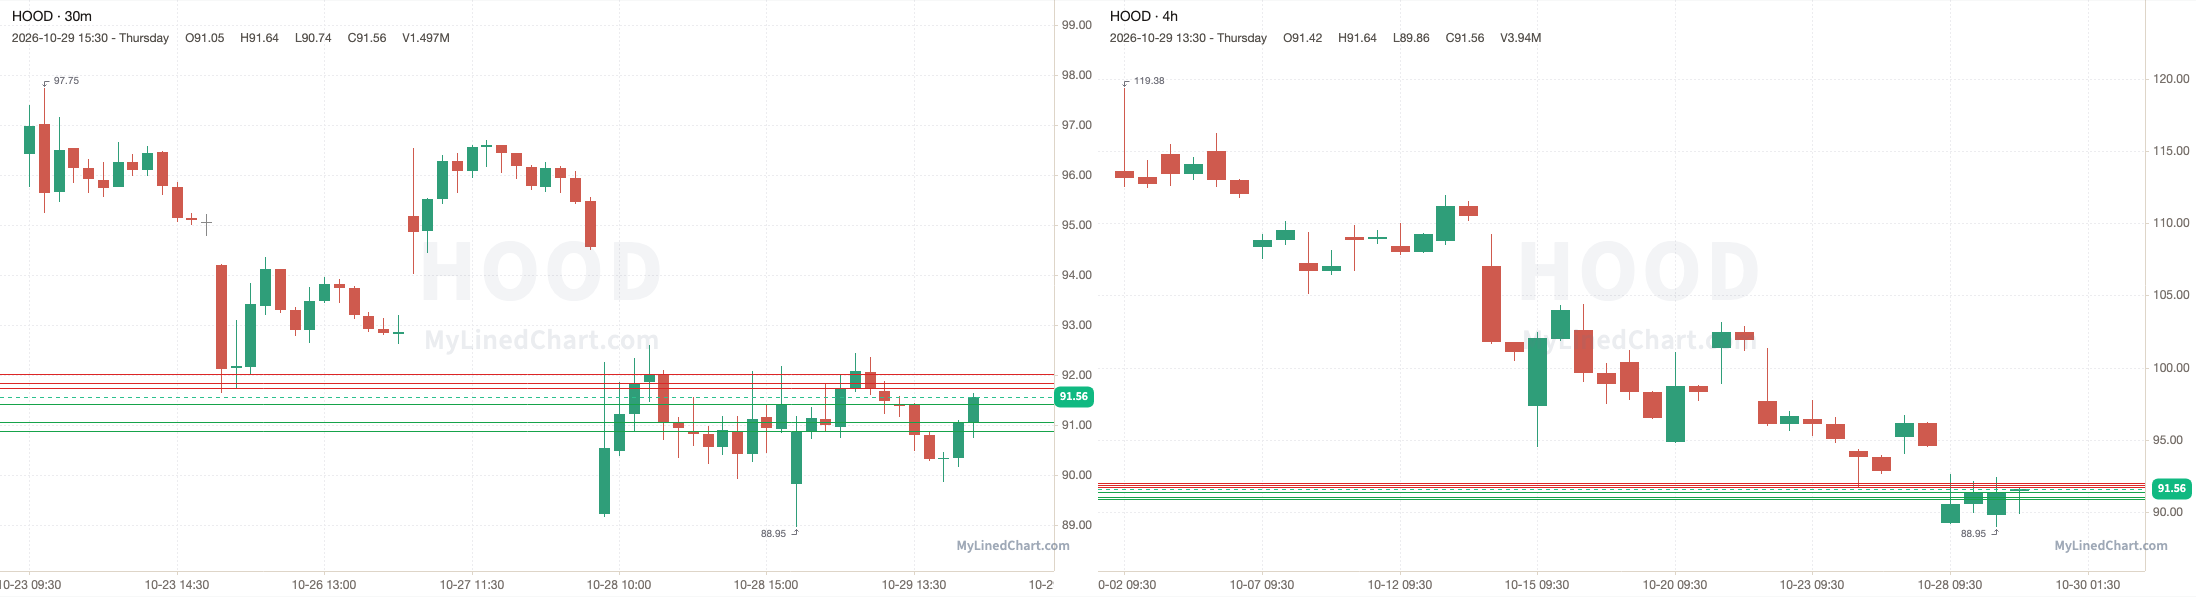
HOOD (Robinhood)
Nearest pivot: 91.41
Above 91.73 → 91.84 next
Above 91.84 → 92.01 next
Above 92.01 → open air
Lose 91.41 → 91.05 next
Lose 91.05 → 90.87 next
Lose 90.87 → open air
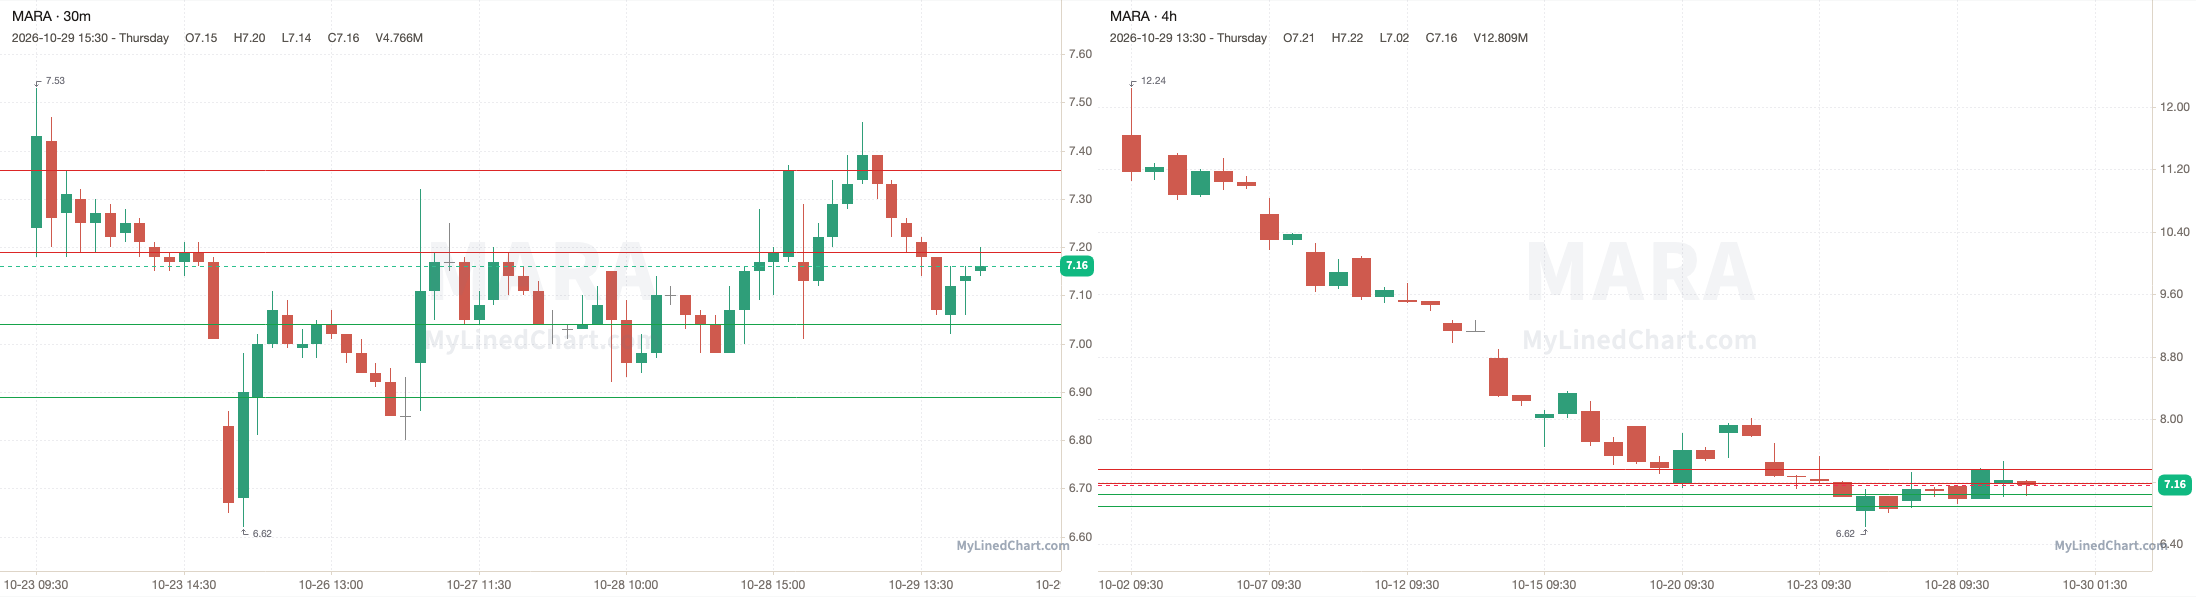
MARA (MARA Holdings)
Nearest pivot: 7.19
Above 7.19 → 7.36 next
Above 7.36 → open air
Lose 7.04 → 6.89 next
Lose 6.89 → open air
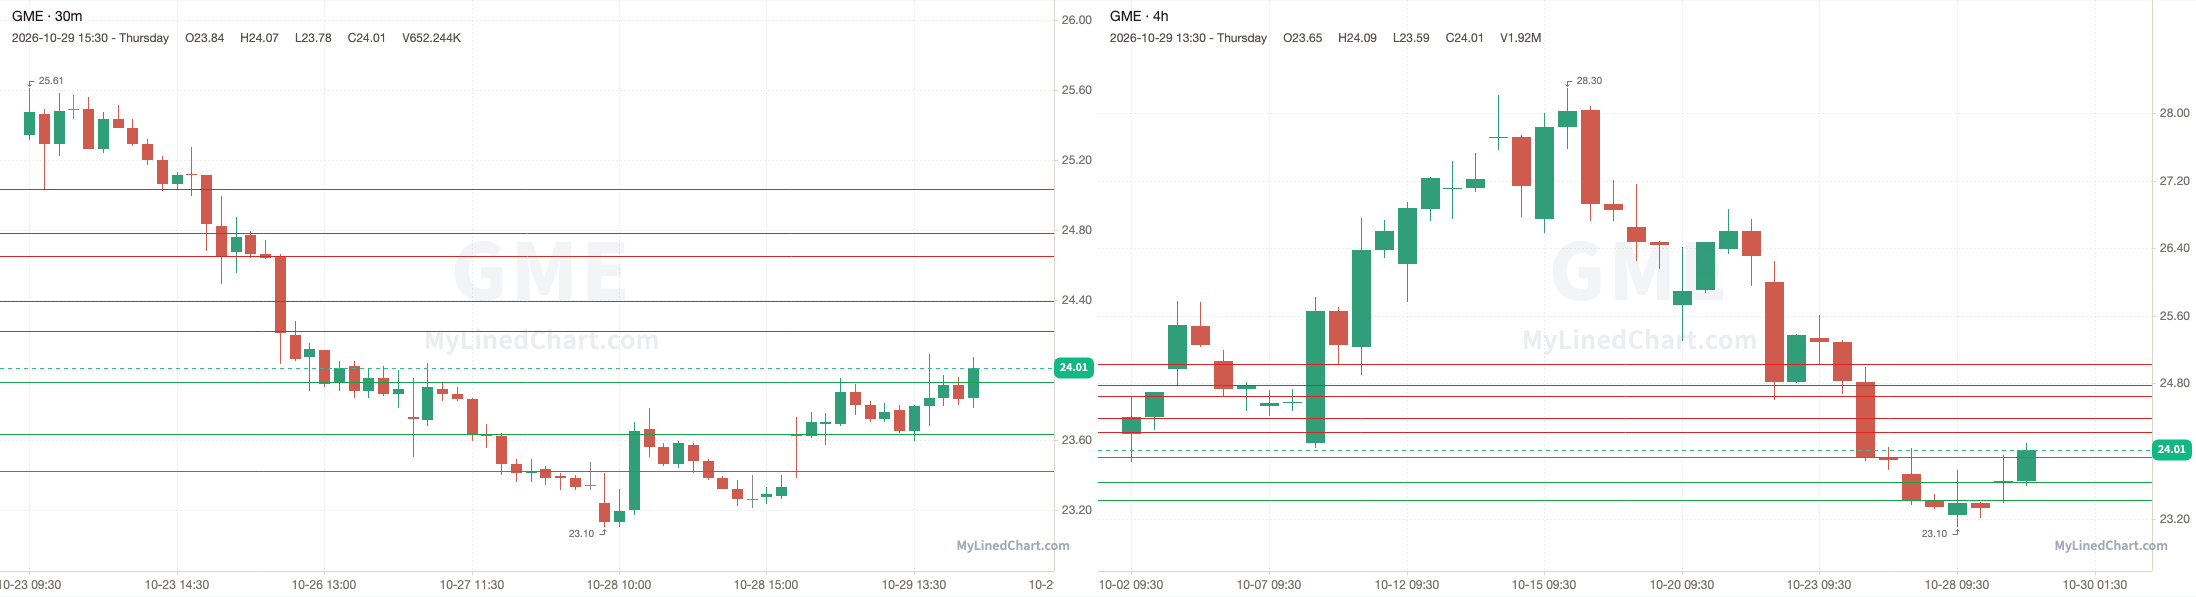
GME (GameStop)
Nearest pivot: 23.93
Above 24.22 → 24.39 next
Above 24.39 → 24.65 next
Above 24.65 → 24.78 next
Above 24.78 → 25.03 next
Above 25.03 → open air
Lose 23.93 → 23.63 next
Lose 23.63 → 23.42 next
Lose 23.42 → open air
IBIT (iShares Bitcoin Trust)
Nearest pivot: 45.83
Above 45.83 → 46.16 next
Above 46.16 → 46.34 next
Above 46.34 → open air
Lose 45.50 → 45.16 next
Lose 45.16 → open air
ETHA (iShares Ethereum Trust)
Nearest pivot: 52.64
Above 52.97 → 53.15 next
Above 53.15 → open air
Lose 52.64 → 52.47 next
Lose 52.47 → 52.25 next
Lose 52.25 → open air
INTC (Intel)
Nearest pivot: 92.07
Above 92.32 → 92.51 next
Above 92.51 → 92.67 next
Above 92.67 → 92.80 next
Above 92.80 → open air
Lose 92.07 → 92 next
Lose 92 → 91.93 next
Lose 91.93 → 91.87 next
Lose 91.87 → 91.77 next
Lose 91.77 → 91.62 next
Lose 91.62 → open air
RIVN (Rivian)
Nearest pivot: 11.53
Above 11.53 → open air
Don't want to wait until just before the open? Pro gets these levels about 1 hour after the close.
Pro also adds how many times price touched each level and the volume traded at that level.
Upgrade to Pro: https://littlebirdtrading.com/pricing
Touches and volume
Unlock with ProPro gets these levels about 1 hour after the close, plus touches and volume at every level.
✓ Every symbol with All Access✓ Sent to your inbox✓ MyLinedChart levels for your own rules and journaling
Disclaimer: Little Bird Trading and any of its associations may or may not, whether long or short, have a position in any instruments. Not investment advice. Provided for informational purposes only. Not a recommendation or endorsement. Not registered or licensed. Model portfolios are property of their respective owners. All data is sourced from publicly available information. No guarantee is being made or offered. Not responsible for financial loss or ruin. Little Bird Trading may earn a commission if you purchase through links on the site.